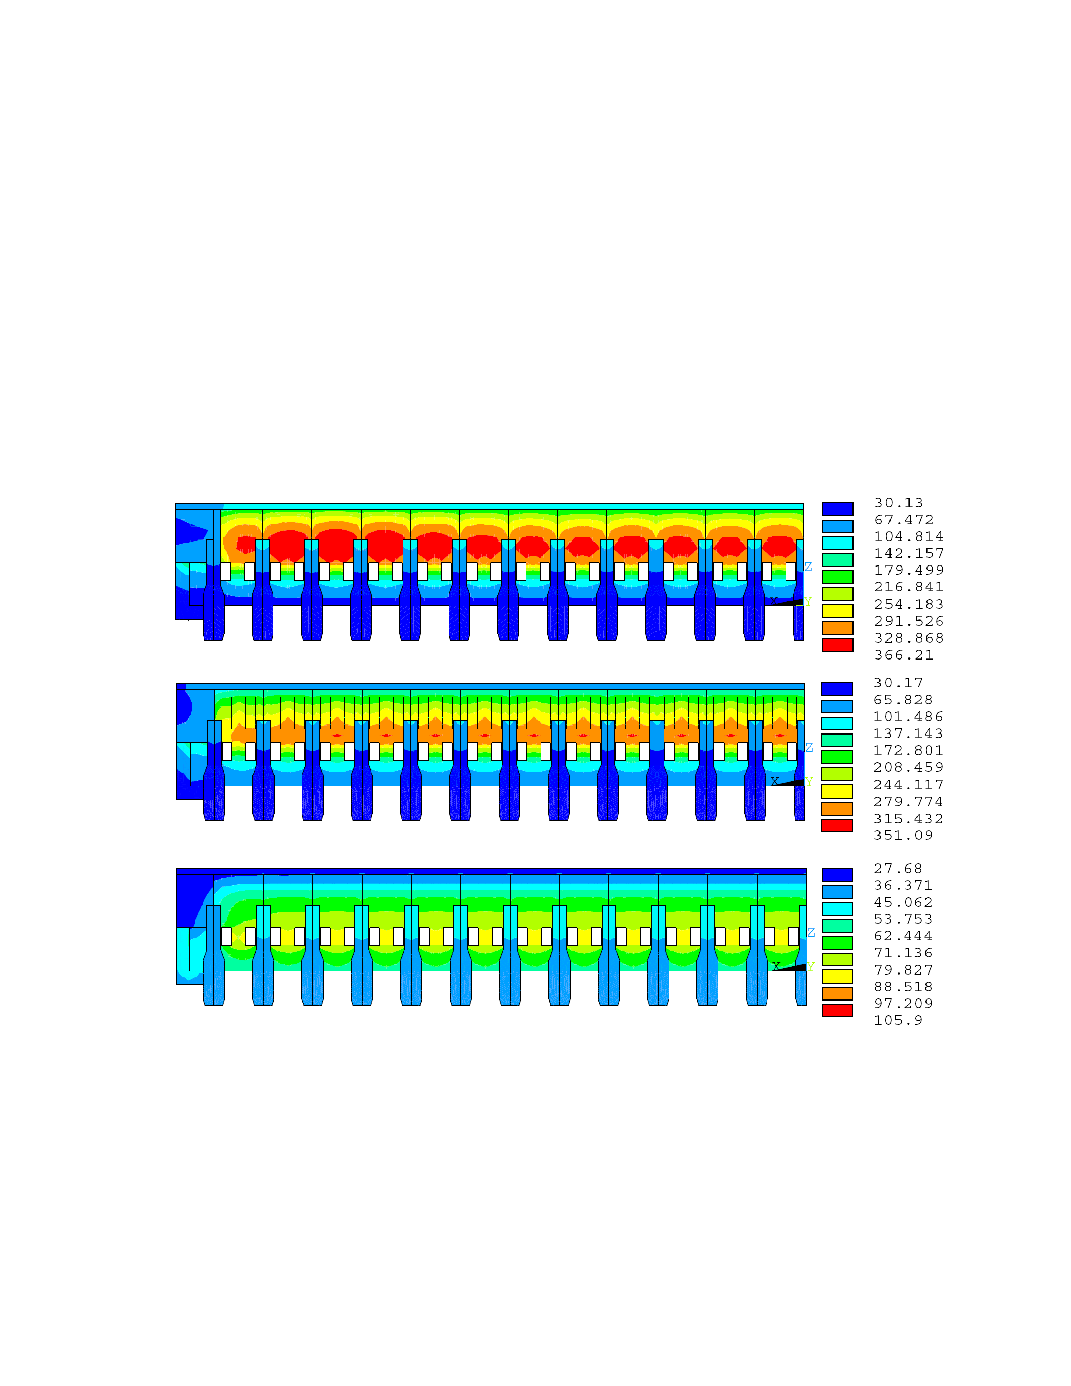
The obtained temperature distributions are shown in Figure 8a) for the 500 kA
cooling. The fin configuration used in Figure 8b) reduces the temperature gradient in the
shell upper sidewall and its maximum temperature. Like in the 300 kA case, the forced-
air cooling (Figure 8c) is so effective that the maximum shell temperature is now on the
floor. This time however, the difference between the shell floor and the sidewall
temperatures is larger than in the 300 kA case (Figure 5).
The vertical displacement on the long axis of the shell floor is compared for all