presents the correlation between the slope of the cell voltage and the concentration of
dissolved alumina for all 5 cycles.
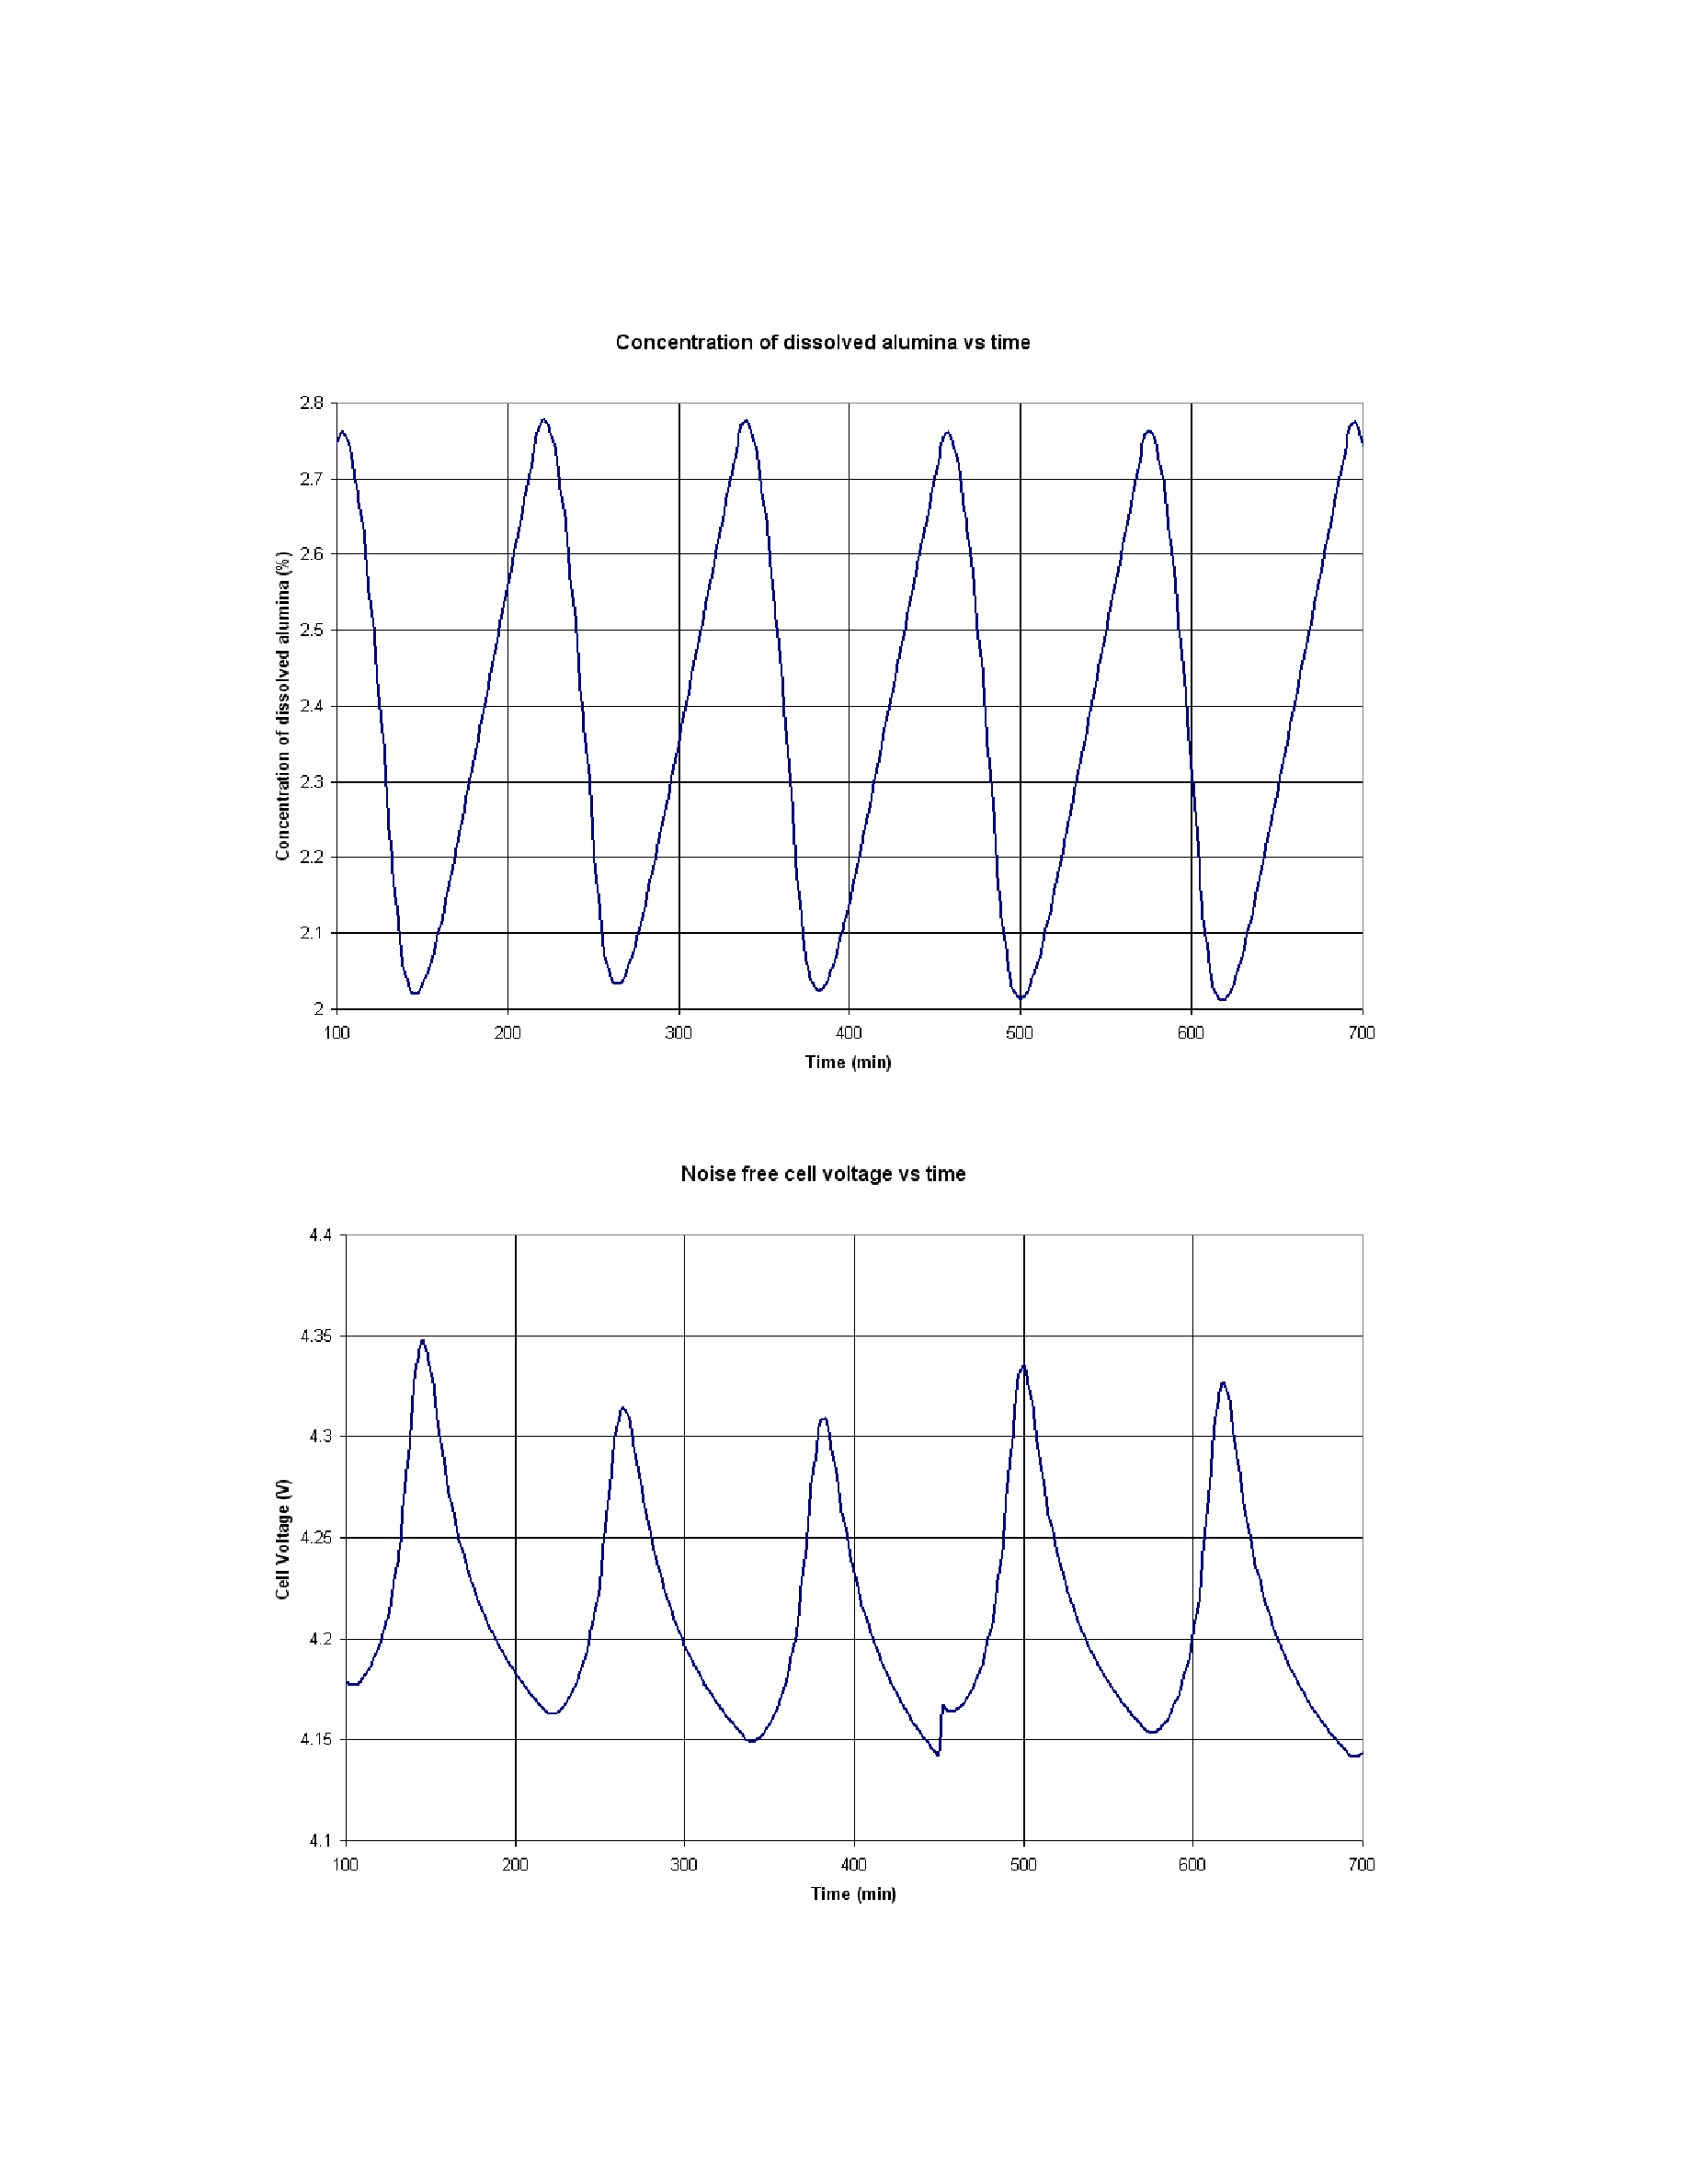
Figure 13: Concentration of dissolved alumina vs. time during continuous tracking
Figure 14: Noise free normalized cell voltage vs. time during continuous tracking