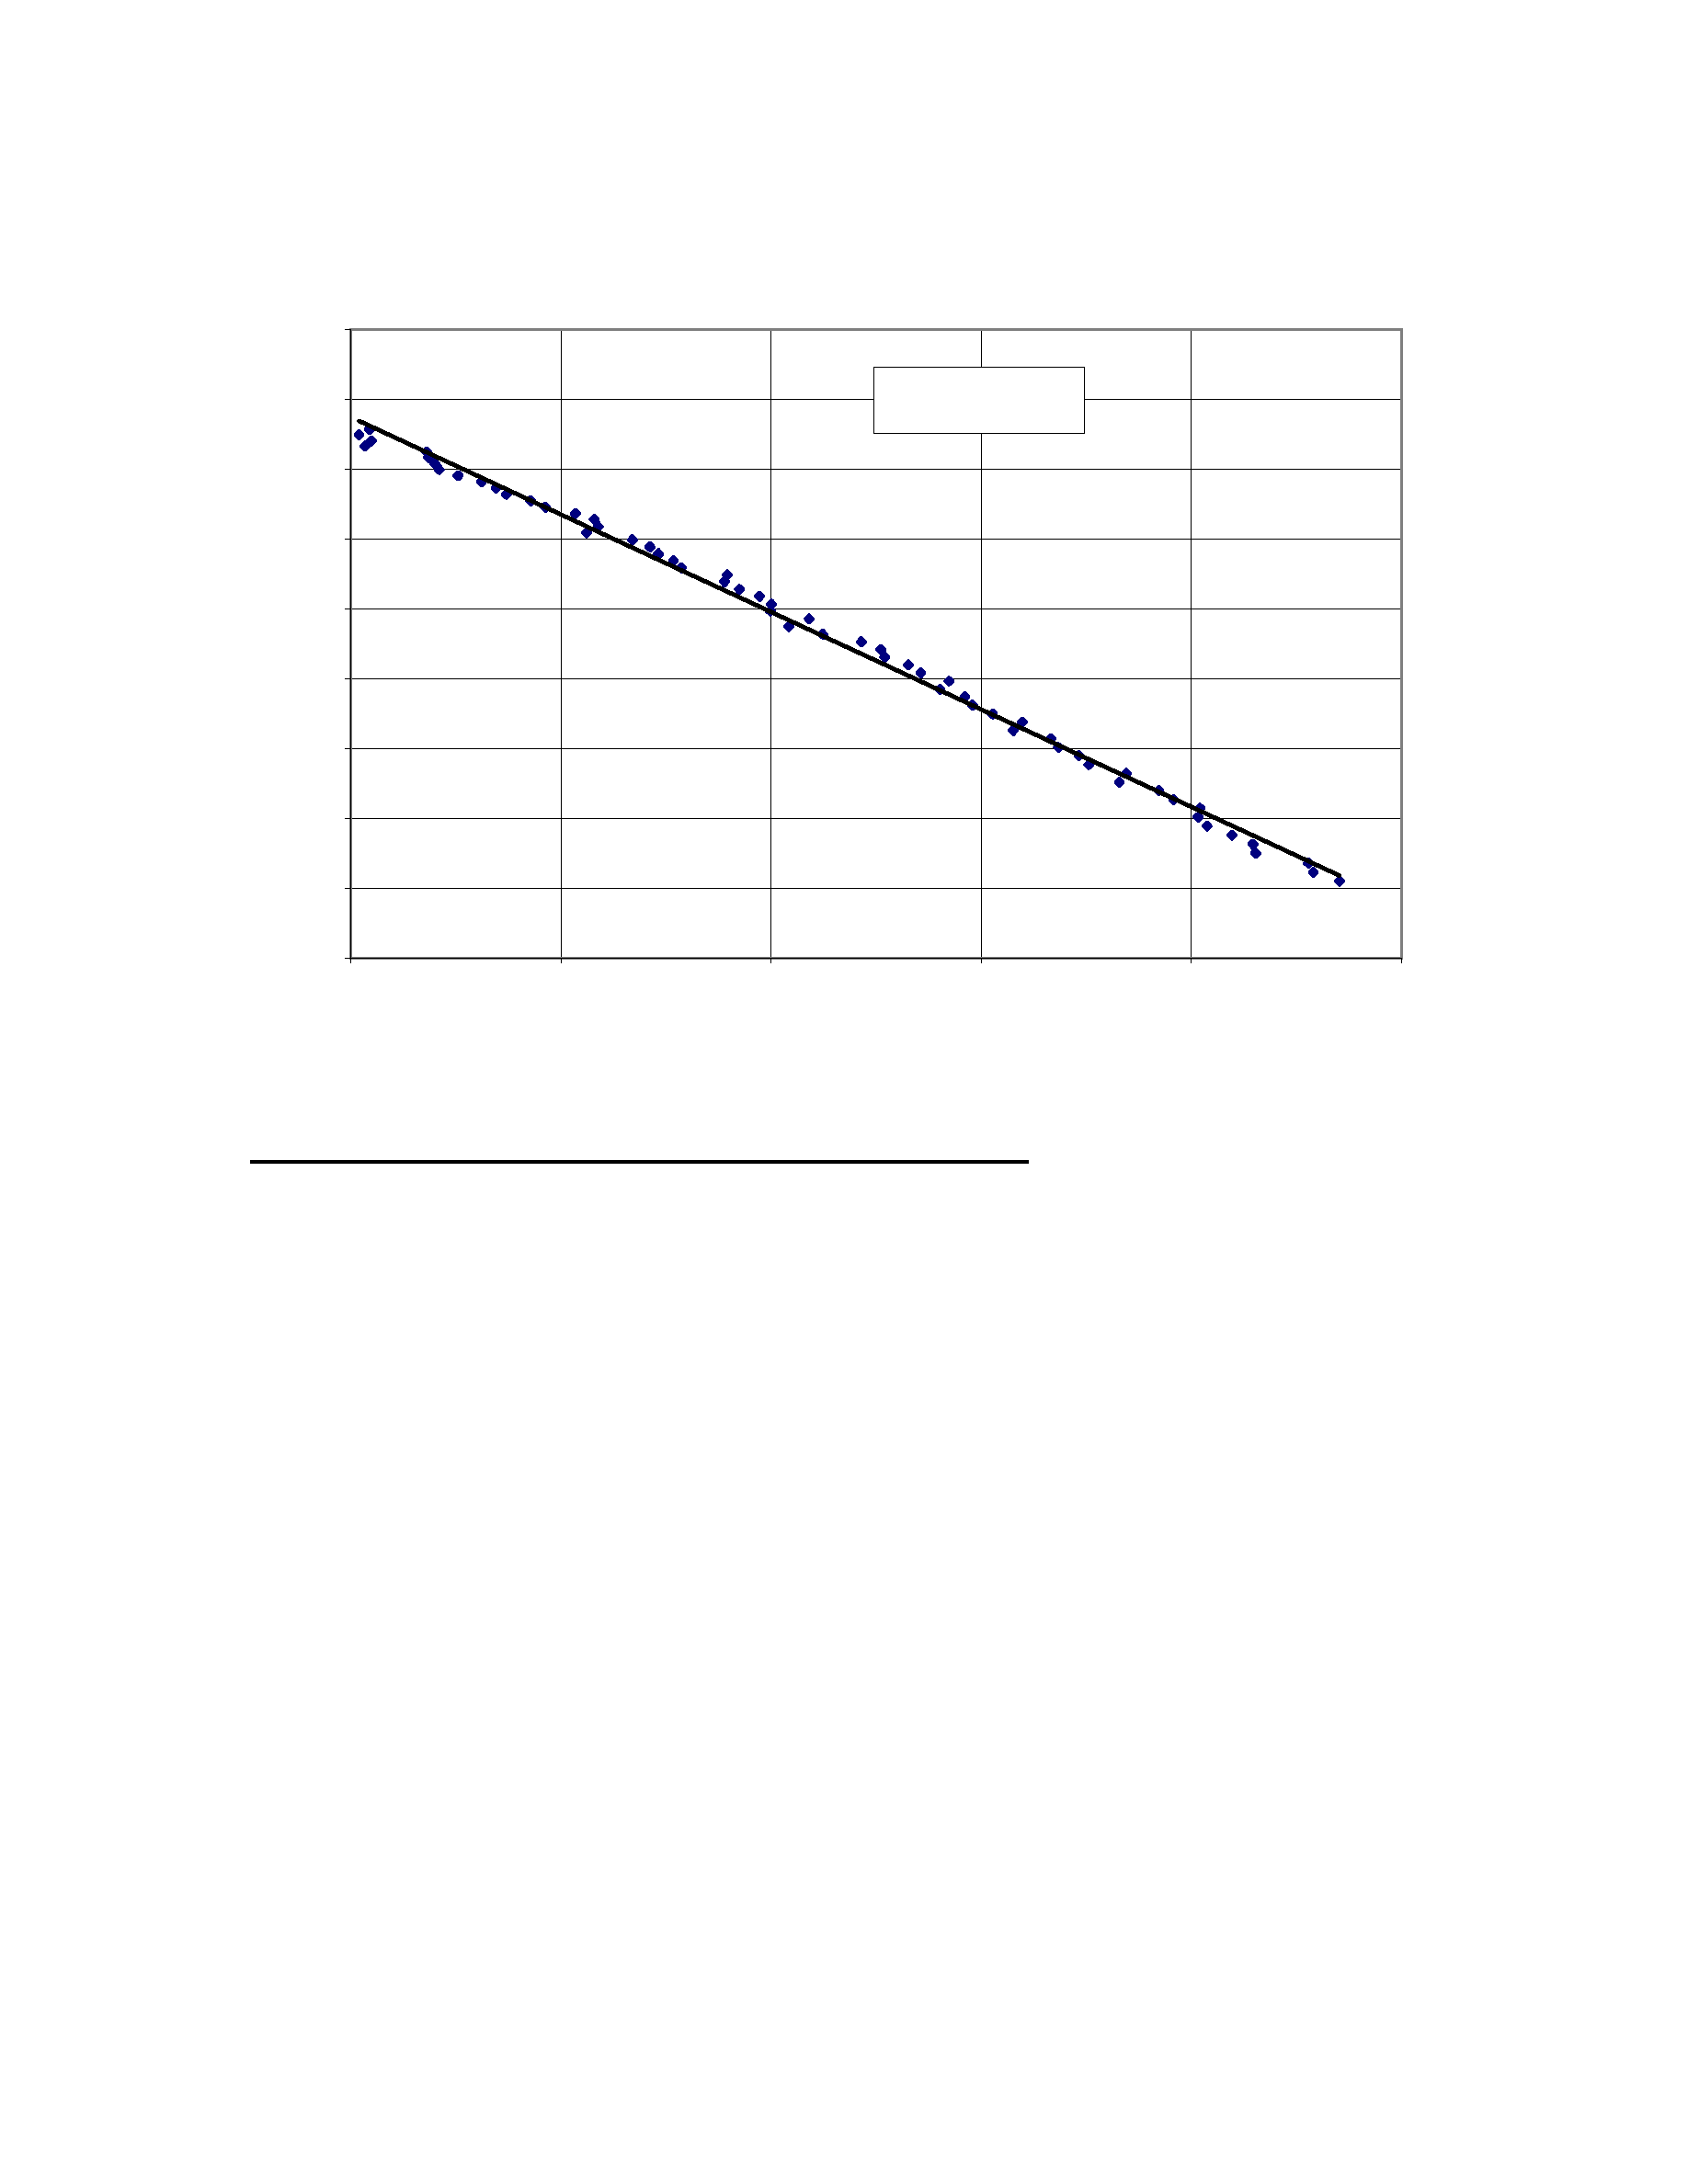
Concentration of dissolved alumina vs time slope of the cell voltage
y = -0.0279x + 2.3193
R
2
= 0.9961
2.2
2.21
2.22
2.23
2.24
2.25
2.26
2.27
2.28
2.29
1.5
2
2.5
3
3.5
4
Time slope of the cell voltage (mV/min)
C
o
n
c
e
n
t
r
a
t
i
o
n
o
f
t
h
e
d
i
s
s
o
l
v
e
d
a
l
u
m
i
n
a
(
%
)
Figure 16: Dissolved alumina concentration vs. the slope of the normalized cell voltage
Primary calibration surface and estimation of the ACD
Once the concentration of dissolved alumina in the bath has been estimated, it is
essential to also estimate the ACD using the primary calibration surface.
In previous In Situ papers, the concept of primary calibration curve is presented.
It is simply the observation that when all the other variables affecting the cell voltage are
kept constant, it is possible to correlate the concentration of dissolved alumina in the bath
with the noise free normalized cell voltage using the following equation:
1 / ( C
Al2O3
- C
Al2O3-AE
) = CoeffA * EXP ( CoeffB * V
n
)
(2)
Where:
V
n
is the estimated noise free normalized cell voltage (V)
C
Al2O3
is the In Situ estimated concentration of dissolved alumina in the bath (%)
C
Al2O3-AE
is the estimated concentration of dissolved alumina triggering an anode
effect (AE) (%)
CoeffA
is the first coefficient of the correlation
CoeffB
is the second coefficient of the correlation