to be the ones used by Dyna/Marc. This can be done in an Excel worksheet by
specifying the value of all those other variables like the ACD, the cell temperature, the
current density, anode cathode and busbar voltage drops, the bath chemistry etc., and
calculating the resulting predicted cell voltage covering a range of values for the
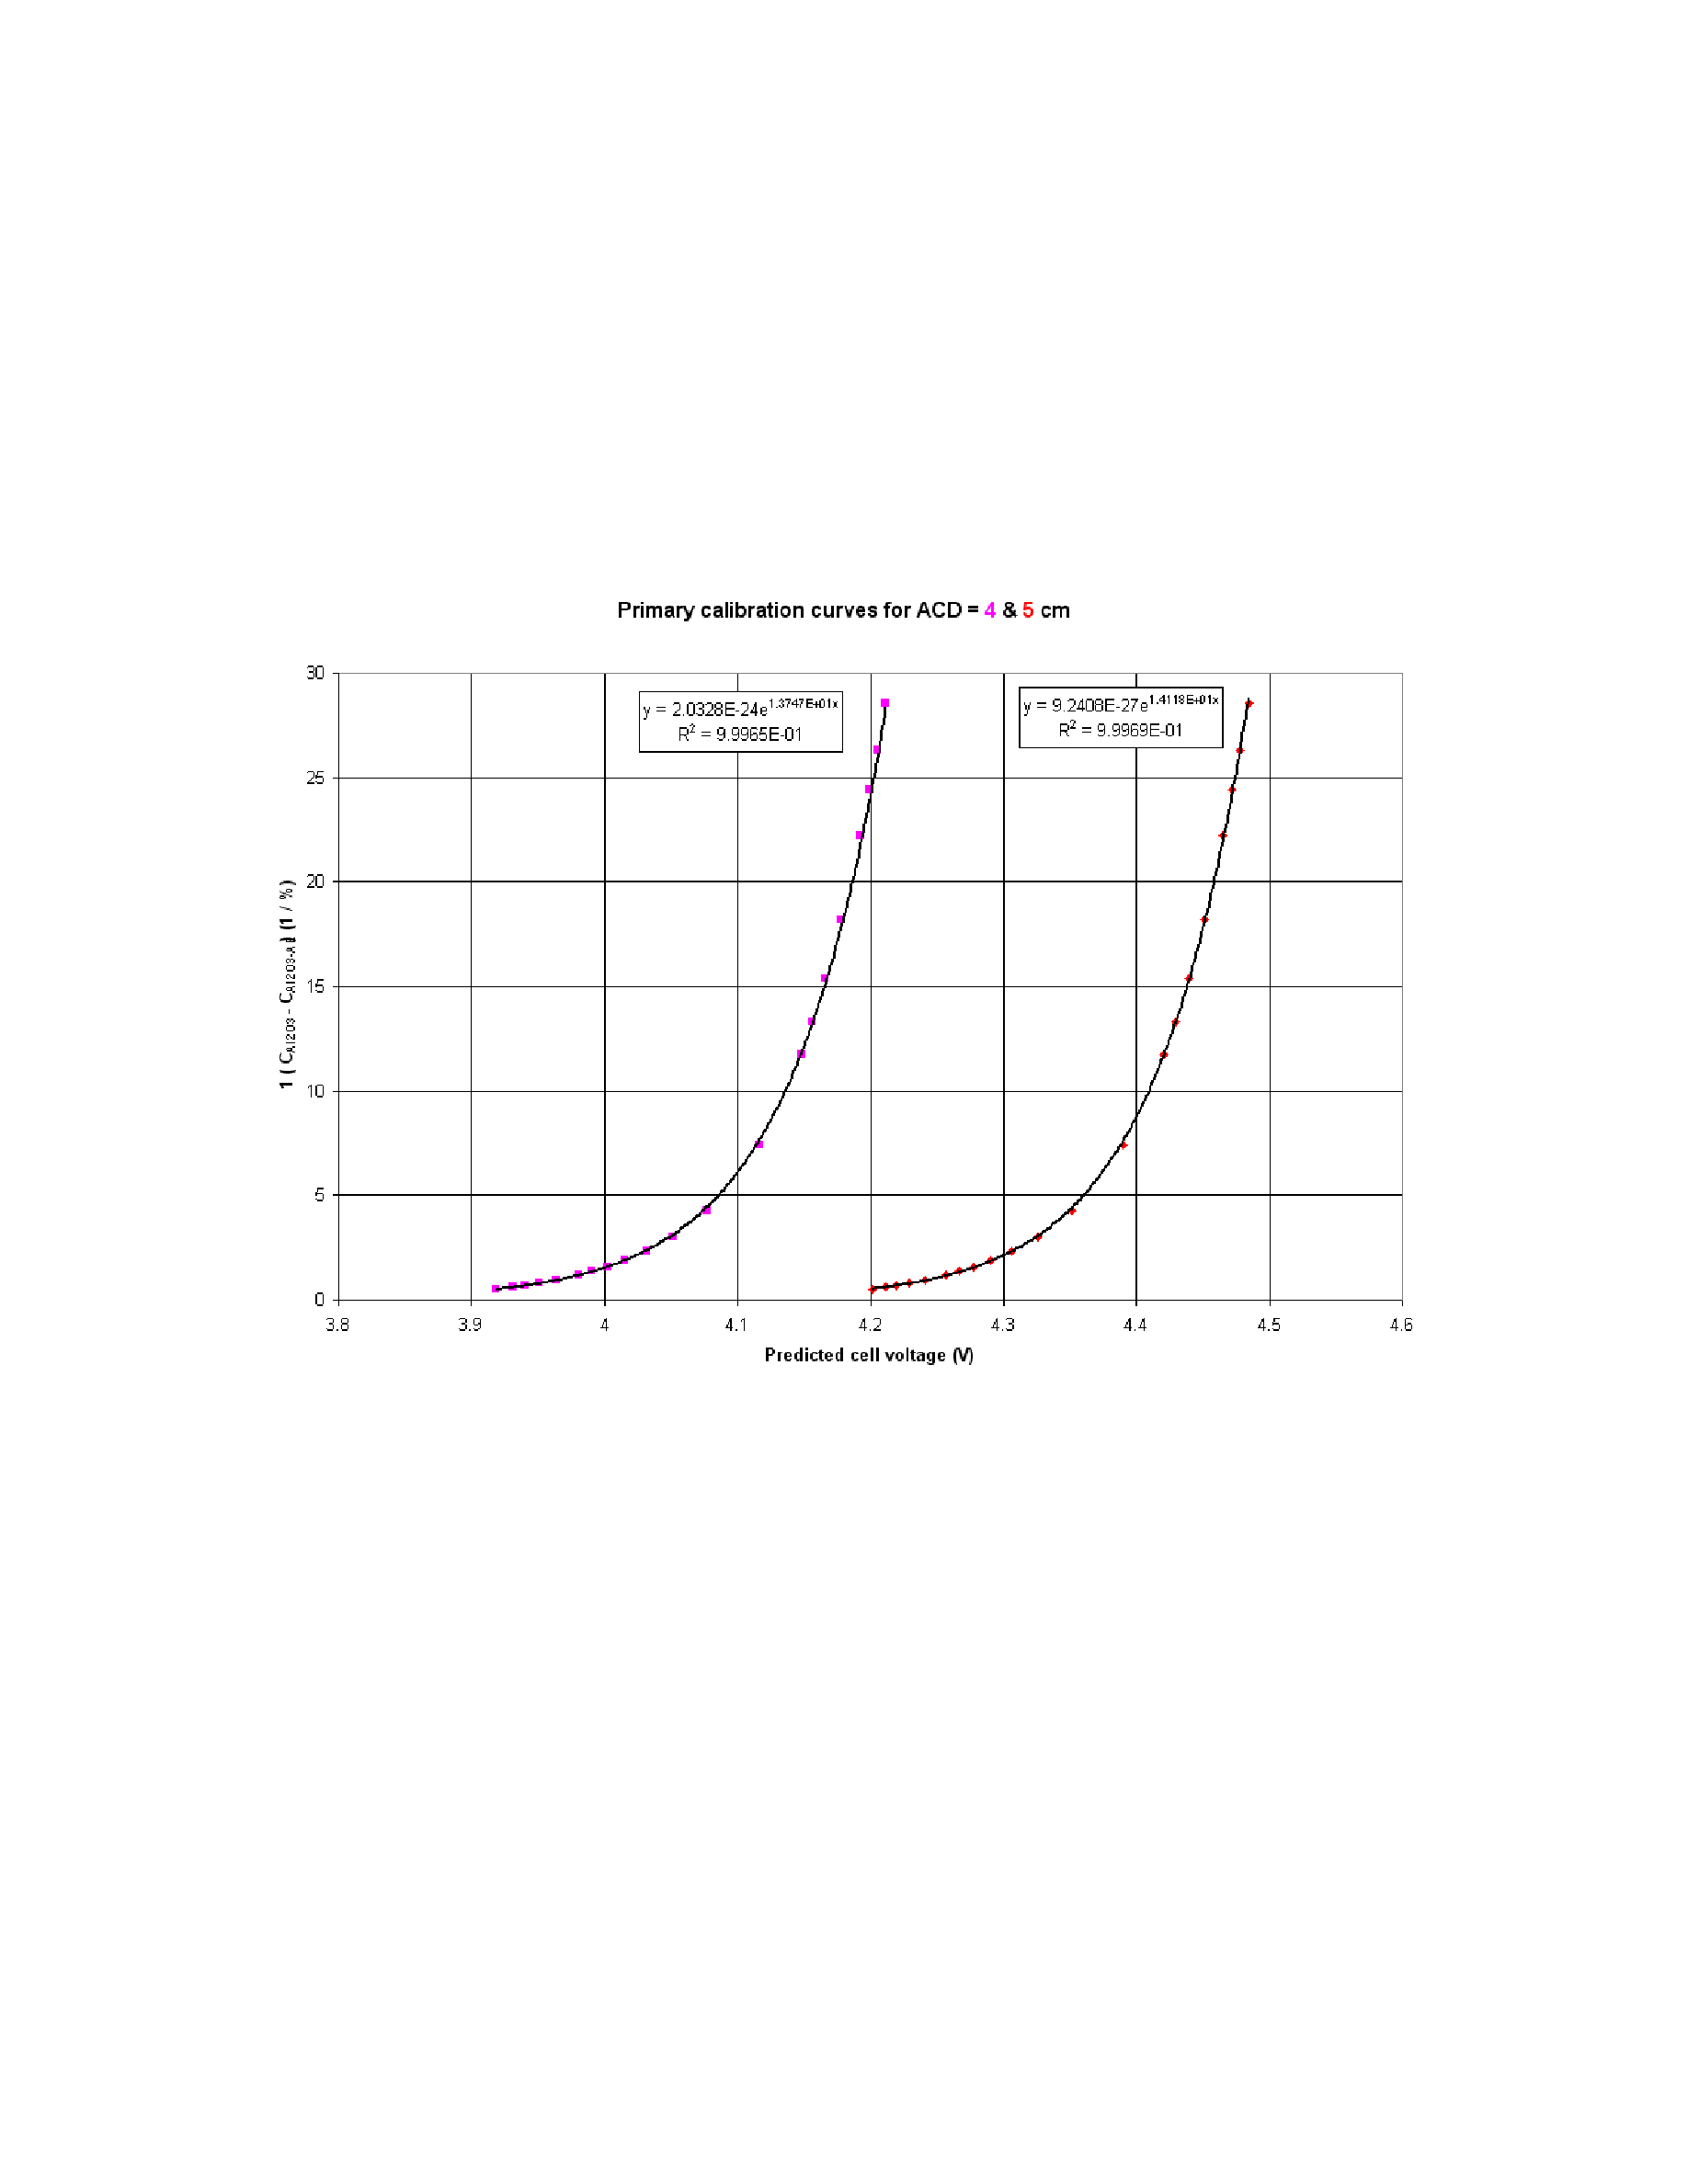
concentration of dissolved alumina. The exponential curve on the left of Figure 17 was
obtained using 4 cm ACD while the right curve was obtained using 5 cm ACD.
For the cell conditions selected, CoeffA = 2.0328E-24 and CoeffB = 13.747 when
C
1 / ( CAl2O3 - CAl2O3-AE) = 1 / 0.245 = 4.08
From that we can calculate that at 2.21 % of dissolved alumina, the predicted cell
( LN(4.08) - LN(2.0328E-24) ) / 13.747 = 4.071 V, at 4 cm ACD
( LN(4.08) - LN(9.2408E-27) ) / 14.118 = 4.346 V, at 5 cm ACD