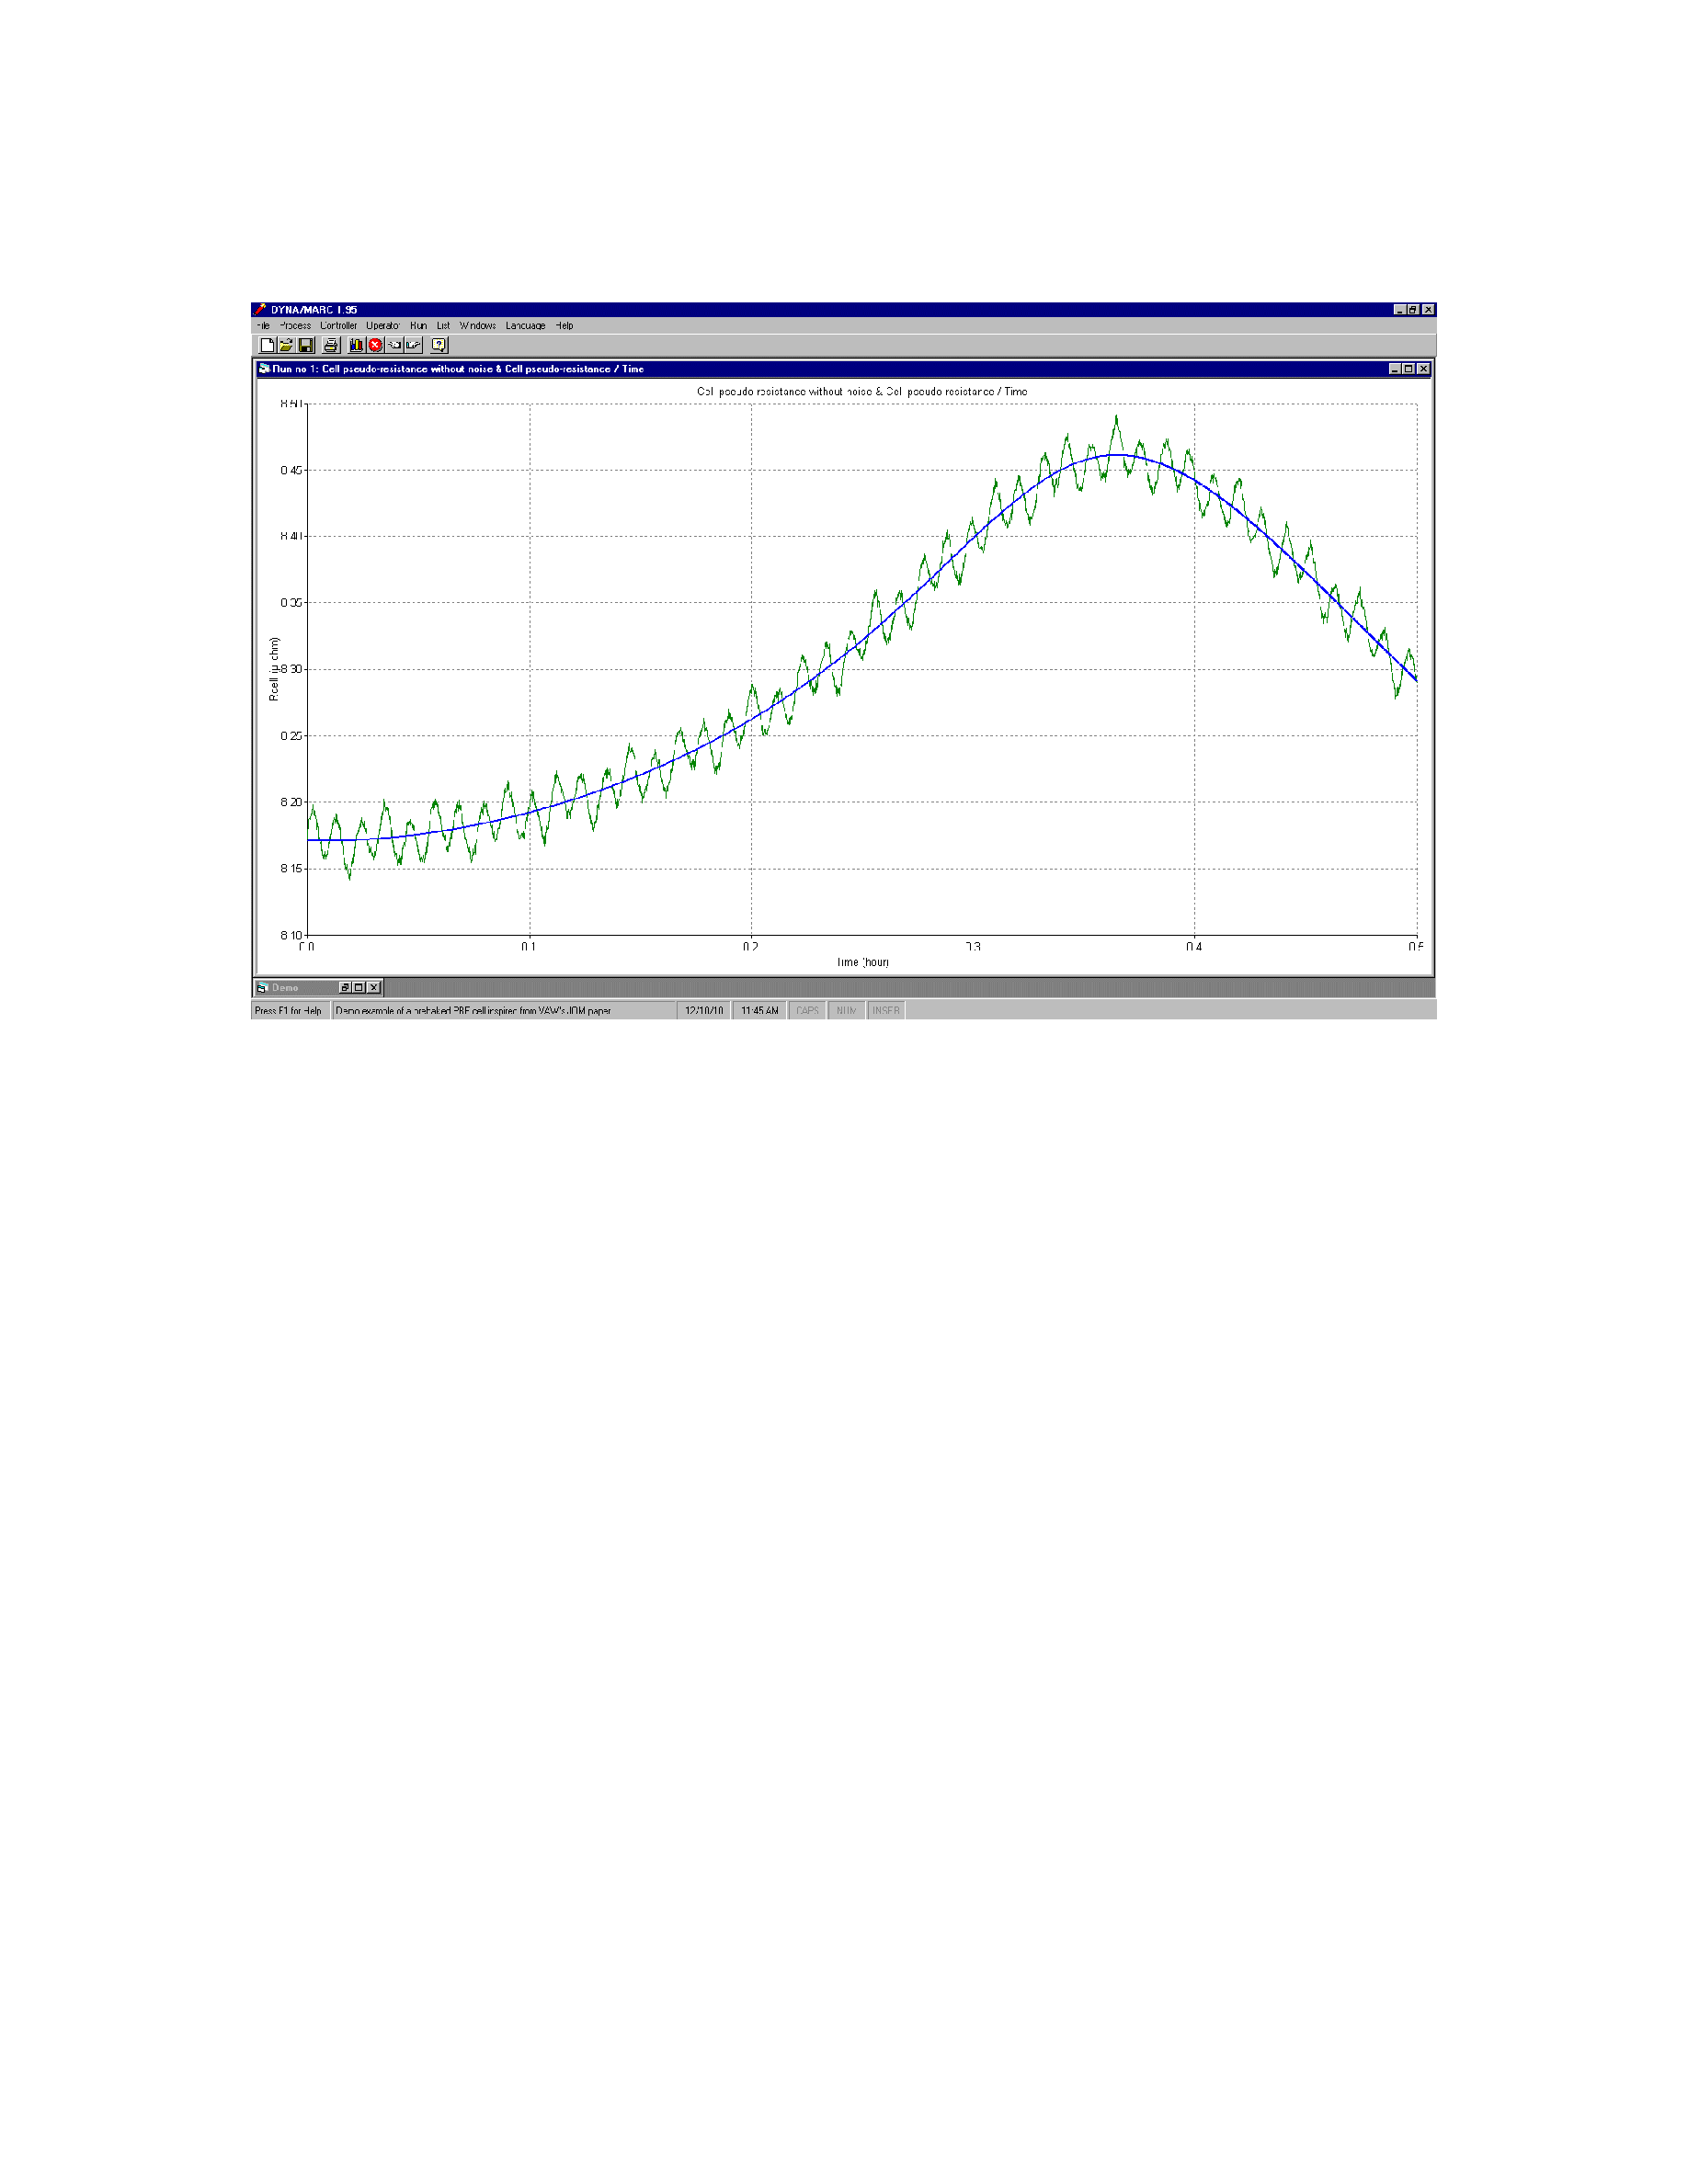
Figure 4: Noisy and noise free evolution of the cell pseudo-resistance
The first question that comes to mind, considering the nature of a noisy signal, is
helpful in decreasing this type of noise?
To remove the noise having a frequency of about 0.008 Hz, it is required to
more than 1200 data points if a 10 Hz data sampling rate is used. As can be seen in
Figure 5, the higher frequency noise is almost completely removed and the resulting red
curve is a good fit of the blue curve in Figure 4.
Notice that the red curve locates the calculated average voltage at the average
The black curve is the moving average curve the way Excel presents it, which is
incorrect. In order to assess the averaged or smoothed value at the time of the last data
point collected (which is assumed to be the present time), an extrapolation of the red
curve would need to be performed which would require some kind of data fitting.
Moving averages can also be used to reduce the number of data points to perform
moving averaged values every 6 seconds. This would remove very high frequency noise
of 0.2 Hz and higher so it would remove CO