TURBULENCE MODELING OF AIR CIRCULATION
IN AN ENCLOSURE WITH MULTIPLE OPENINGS AND
LOCAL HEAT SOURCES
Marc Dupuis and Edgar Dernedde Alcan International Limited, Arvida Research and Development Centre JonquiÒre, Quebec, Canada G7S 4K8 Diane S. Clarke Computational Fluid Dynamics Services, Harwell Laboratory Oxfordshire, United Kingdom, OX11 ORA
ABSTRACT
The air circulation inside an enclosure with multiple openings and local heat sources was studied by means of a mathematical model using the commercial CFD program FLOW3D. The results of the standard K-E turbulence model and the differential Reynolds flux turbulence model were compared to experimental data, which were obtained from a physical model. The flow pattern and the temperature distribution predicted by the standard K-E turbulence model were in fair agreement with the experimental data. The predictions of the differential Reynolds flux turbulence model were in better agreement with the experimental data for the thermal plumes, but were in poor agreement near the floor. The results of the differential Reynolds flux turbulence model are encouraging but should be interpreted with care in the study of turbulent mixed convection problems such as the ventilation in aluminum smelters.
INTRODUCTION
The ventilation in the cell rooms of aluminum smelters is occasionally studied in order to improve the working conditions for cell operators. Such studies are made either directly in the plant or by means of a physical model, which simulates the forced and natural convection flow inside a cell room [l, 2]. However with the advent of advanced hardware and software, attempts have been made to use a mathematical model for such studies [3]. Other workers have also addressed air circulation problems in rooms with or without buoyancy effects using the K-E turbulence model [4-6]. The results have met with varying success and research in this area is continuing.
The present study was undertaken in order to examine two turbulence models available in the FLOW3D software from CFDS. The simulations were run on a Silicon Graphics computer.
Mathematical Model
Two-dimensional incompressible Newtonian flow with heat transfer was considered, which is described by the continuity equation, the Navier-Stokes equation and the energy equation. These equations were solved by the FLOW3D software for a steady-state solution. FLOW3D uses the finite volume approach and hybrid up-wind differencing. For turbulence, either the K-E model or the differential Reynolds flux model were used. The geometry and the boundary conditions were the same as those used in a previous study [3].
The mathematical model simulated the flow and temperature inside a physical model of a cell room of an aluminum smelter. The grid layout for the mathematical model is shown in Figure l representing one half of the cell room model. Eighteen blocks were used to define the cell room geometry. In order to improve the accuracy of the convection patterns near the heat source, denser meshing was used around the rectangular block, which represented the electrolytic cell. There were two inlet openings in the floor, one inlet opening in the sidewall and one outlet opening in the roof. Three different ventilation arrangements were tested and compared to experimental data.
Figure 1: Grid layout for the mathematical model
The experimental data were obtained from a 1:24 scale physical model, which represented a slice of a cell room [3]. The air velocities and air temperatures were measured at many locations inside the physical mode. The air inlet temperature was 20 ¯C.
Case 1 - Sidewall Openings Closed
In this case the sidewall openings were closed and fresh air entered only through the floor openings. The experimental data are shown in Figure 2. The left side shows the streamlines and the right side shows the isotherms. A plume of warm air rose above the hot cell model and two recirculating loops existed on each side of the plume. The airspeed above the cell model was 0.13 Ý 0.01 m/s. Strong temperature gradients existed near the cell model and the plume had a low temperature of about 30 ¯C.
|
|
 Smoke concentration
Streamlines
Isotherms
Smoke concentration
Streamlines
Isotherms
Figure 2: Experimental Data
The K-E turbulence model predicted the flow pattern fairly well, however the airspeed of 0.21 m/s above the cell model was too high (Figure 3). There was a strong thermal plume above the cell model with a temperature of about 40 ¯C. It seems that the intensity of the thermal plume was overpredicted.
|
|
Flow pattern
Isotherms
Figure 3: Flow pattern and isotherms predicted by the K-E turbulence model
The Reynolds flux turbulence model predicted a thermal plume above the cell model with an airspeed of 0.11 m/s and an air temperature of about 30 ¯C (Figure 4). The thermal plume was more diffuse than that predicted by the K-E turbulence model. However despite these good predictions above the cell model, the air temperatures of 10 ¯C at the floor near the cell sides were too low, i.e. below the air inlet temperature.
|
|
Flow pattern
Isotherms
Figure 4: Flow pattern and isotherms predicted by the Reynolds flux turbulence model
Case 2 - Sidewall Openings Open
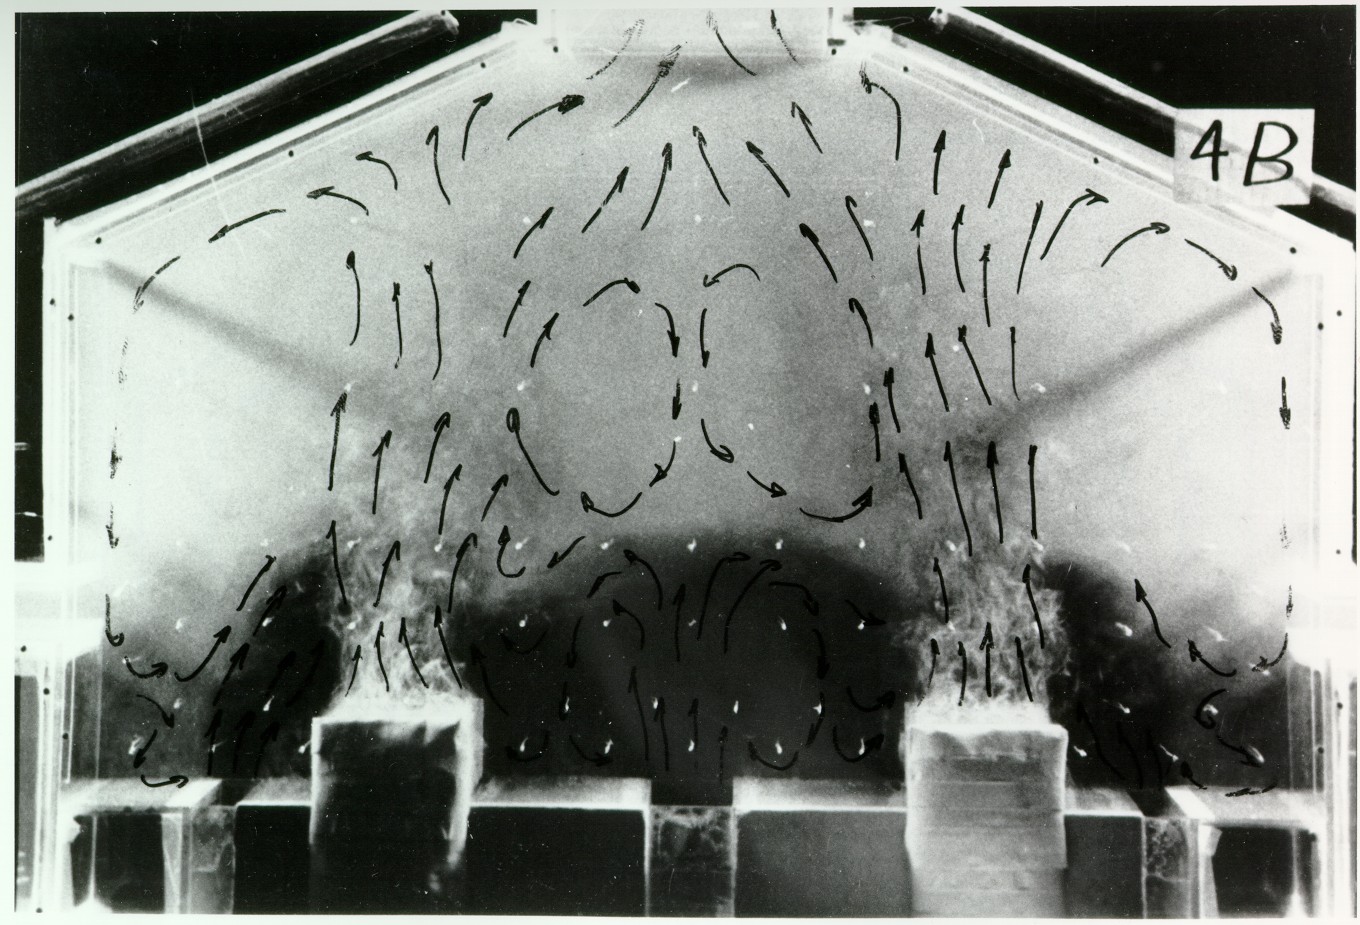
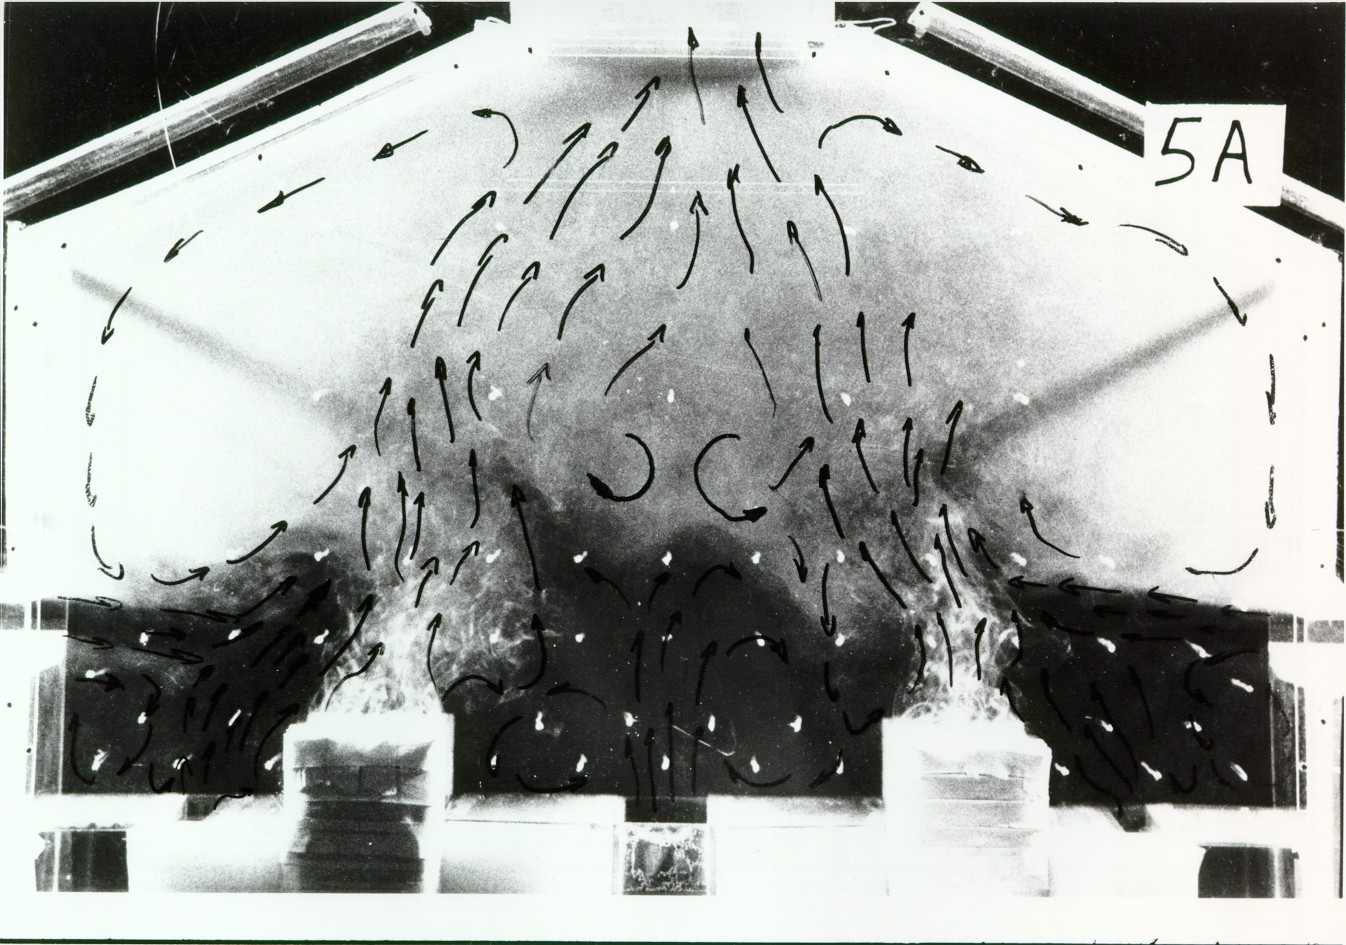
In this case the sidewall openings were open and fresh air entered through all the inlet openings. The experimental data are shown in Figure 5. Due to the flow from the sidewall openings, the thermal plume above the cell model was inclined at 20¯ towards the center of the building model. There was a large recirculating loop under the roof and a small recirculating loop above the center floor opening. The isotherms showed steep temperature gradients near the cell model with a small peak of 32 ¯C above one edge of the cell model the temperatures were almost constant under the roof.
|
|
Smoke concentration
Isotherms
Figure 5: Experimental Data
With the K-E turbulence model the flow pattern was similar to that observed in the physical model (Figure 6). However, the influence of the flow from the sidewall was overpredicted, since the thermal plume was pushed too much towards the center of the building. The isotherms show a narrow plume inclined at 45 ¯ and at a high temperature of 40 ¯C.
|
|
Flow pattern
Isotherms
Figure 6: Flow pattern and isotherms predicted by the K-E turbulence model
With the Reynolds flux model the thermal plume was inclined at 15 ¯ towards the center of the building model (Figure 7). The isotherms show a small peak of 30 ¯C above the cell model. Both of these predictions were in good agreement with the experimental data. However, the air temperature near the floor was only 10 ¯C and this low temperature region was large on the left side of the cell model.
|
|
Flow pattern
Isotherms
Figure 7: Flow Pattern and isotherms predicted by the Reynolds flux turbulence model
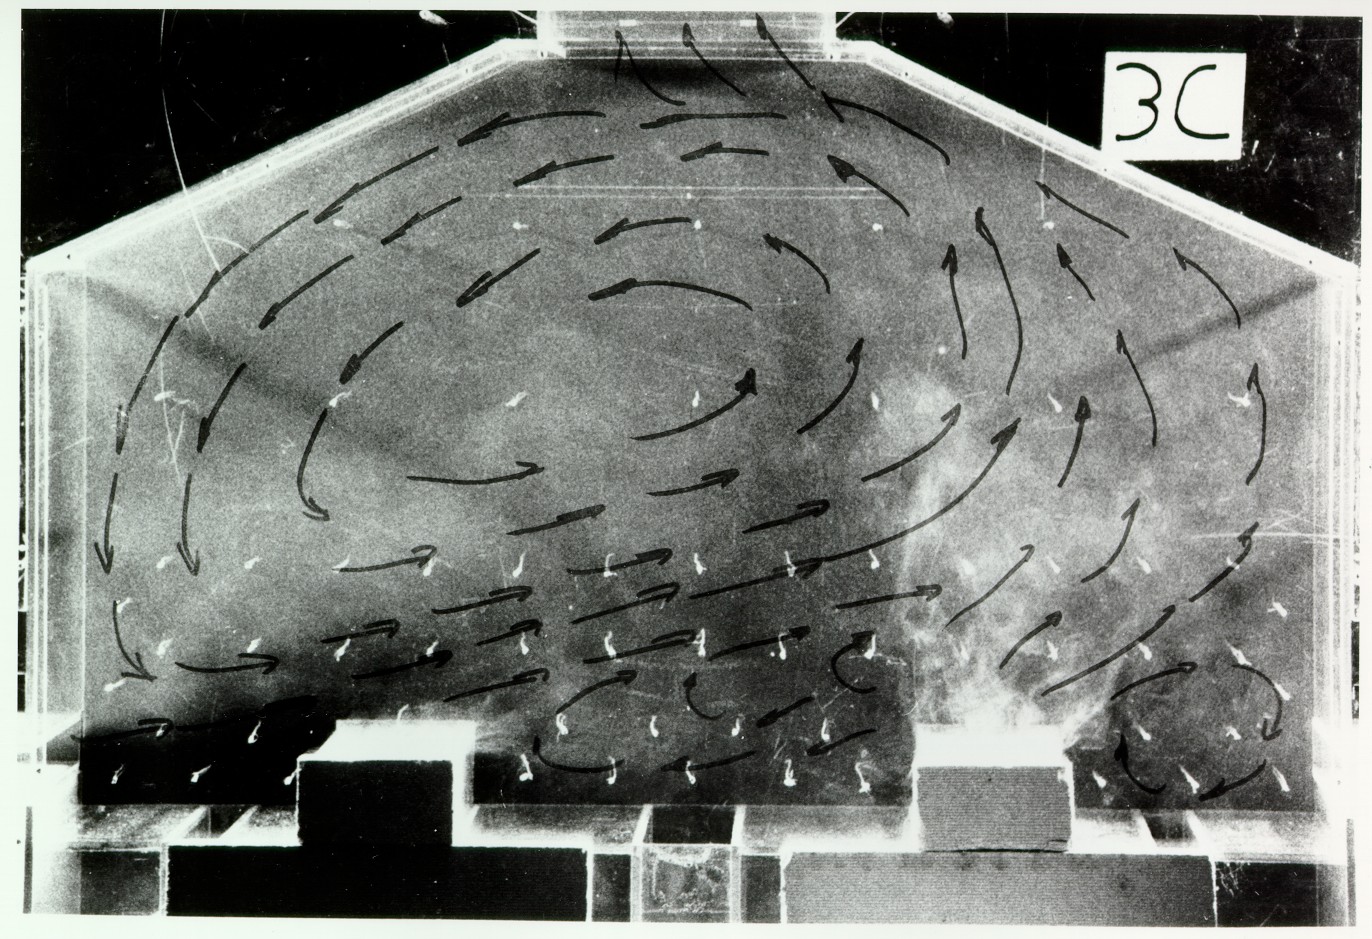
Case 3 - Sidewall Openings Open and Wind
In this case the effect of wind was simulated by increasing the flow through the sidewall opening on the left side of the building model. The flow in the entire cell room was simulated, since the flow pattern was no longer symmetric with respect to the centerline. The experimental data showed that the thermal plume above the cell model on the left was flattened and the thermal plume above the cell model on the right was inclined towards the right (Figure 8). A large recirculating loop existed under the roof. The isotherms indicated a cool zone of 29 ¯C on the left side of the building and a warm zone of 34 ¯C on the right side of the building.
|
|
Smoke concentration
Isotherms
Figure 8: Experimental Data
The K-E turbulence model predicted the flow patted fairly well (Figure 9). The isotherms showed a cool zone of 27 ¯C on the left and a warm zone of 37 ¯C on the right.
|
|
Flow pattern
Isotherms
Figure 9: Flow pattern and isotherms predicted by the K-E turbulence model
The Reynolds flux turbulence model also predicted the flow pattern fairly well (Figure 10). The isotherms showed a cool zone of 27 ¯C on the left and a warm zone of 34 ¯C on the right. The thermal plume above the cell model on the right was more effective than that of the K-E turbulence model. The temperatures near the floor were higher than those of the K-E turbulence model or those of the experimental data.
|
|
Flow pattern
Isotherms
Figure 10: Flow pattern and isotherms predicted by the Reynolds flux turbulence model
DISCUSSION
Mixed convection was simulated by a mathematical model which represented the ventilation in a cross section of a cell room of an aluminum smelter. Two turbulence models were tested using the FLOW3D software.
The results of the present test cases indicated that the Reynolds flux turbulence model gave a better simulation of the thermal plumes due to natural convection than the K-E turbulence model. Both the flow pattern and the temperature profile of the plume were better simulated by the Reynolds flux model However, the Reynolds flux model makes incorrect predictions of the air temperature near the floor The zone near the floor is the work area of cell operators and it is in this zone where the estimation of the working conditions would be inaccurate. Similar incorrect predictions were encountered when a coarse mesh was used around the cell model. In that case the air temperature directly above the cell was less than the air inlet temperature.
CONCLUSIONS
Although the results of the differential Reynolds flux turbulence model were encouraging, further research seems necessary in order to improve the temperature predictions.
ACKNOWLEDGMENTS
The authors wish to thank Alcan International Ltd. and Computational Fluid Dynamics Services for permission to publish this work.
REFERENCES