Development of an AUTODESK CFD Based
3D Model of a Hall-Héroult Cell Hooding System
HF Capture Efficiency
Marc Dupuis1, Michaël Pagé2 and Frédéric Julien3
1. Consultant, GeniSim Inc, Jonquière, Canada
2. Owner associate, Simu-K inc, St-Nazaire-Du-Lac-St-Jean, Canada
3. Business Development Manager, Estampage JPL Ltd, Trois-Rivières, Canada
Corresponding author: marc.dupuis@genisim.com
Abstract
A full 3D model of a section of a Hall-Héroult anode cover and hooding system was developed
using the code AUTODESK CFD. The model solves the thermo-electric behavior of the anode,
the radiation between the solid surfaces in the model and the air flow inside and outside the cell
hooding system. In addition of the heat dissipated by the anode panel, the model takes into
account the production or evolution of hot CO, CO2 and HF by the cell and the combustion of
the CO at the surface of the crust as source of heat. The model directly solves for the
concentration of HF in the gas, so the cell hooding HF capture efficiency is directly predicted by
the model taking into account all the physic involved.
Keywords: Cell hooding efficiency, CFD, HF capture, HF emission
1.
Introduction
The cell hooding design and the HF capture efficiency are important aspects of a cell design.
This is true today but it will become even more important in the future as in addition to the aim
of maintaining a very high HF capture efficiency, the desire to further reduce the environmental
impact of the Hall-Héroult process will lead to cell designs dissipating less and less heat through
the anode panel. This could be done by increasing the gas temperature under the hood and using
the heat of the exhaust gas to produce electricity and even by capturing the cell CO2 emission.
In order to achieve those objectives, the exhaust gas suction rate will need to be significantly
decreased in order to increase that average gas temperature under hood and increase the CO2
concentration in that exhaust gas while maintaining a very high HF capture efficiency. This in
turn translates into the need to design a very tight superstructure and hooding panels system and
hence the need to design hooding panels that will resist higher gas temperature under the hood
without mechanically weakening or deforming too much and limit the heat loss through them.
In order to be able to predict the cell hooding HF capture efficiency and hooding panels
operating conditions under a wide range of cell operating conditions like cell amperage, anode
cover thickness and especially hooding design and exhaust gas sucking rate, a full 3D model of
a section of a Hall-Héroult anode panel and hooding system was developed using the code
AUTODESK CFD.
2.
AUTODESK CFD Full 3D Model of a Section of a Hall-Héroult Anode Panel and
Hooding System
The full model will include both the 3D thermo-electric model of the anode, the 3D CFD model
of the gas under the hood and outside in the potroom and the solid surface to solid surface
radiation exchange model. As a first step, the 3D thermo-electric model of the anode was
developed in order to reproduce using AUTODESK CFD the ANSYS based 3D thermo-electric
model previously published [1].
1
2.1.
AUTODESK CFD 3D Thermo-electric Model of the Anode
The model developed in this work is only a demonstration model so it is not reproducing any
commercially available cell design. The anode geometry is the same geometry as the previously
published ANSYS based demonstration 3D thermo-electric model, itself inspired from the
VAW 300 cell design published in 1994 [2].
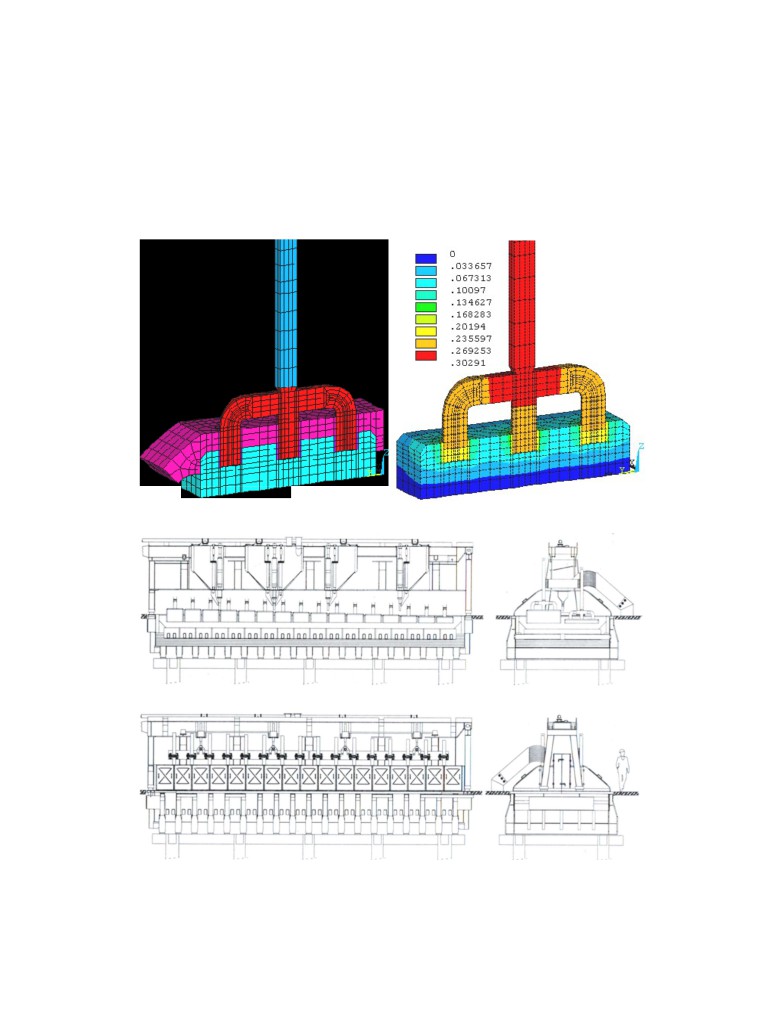
Figure 1. ANSYS based 3D thermo-electric demonstration model from [1]
Figure 2. Sketch of the VAW 300 cell design from [2]
2
The VAW 300 cell was operating at 300 kA and was using 32 1.6 m x 0.8 m anodes. Each
anode had 3 stubs in line. Using identical geometry and material properties and very similar
combined convection and radiation boundary conditions but a much finer mesh, the
AUTODESK CFD model results are very similar to the based ANSYS model.
Figure 3. AUTODESK 3D based 3D thermo-electric equivalent model
2.2.
AUTODESK CFD Full 3D Model of a Section of a Hall-Héroult Anode Panel and
Hooding System
2.2.1. Model Geometry
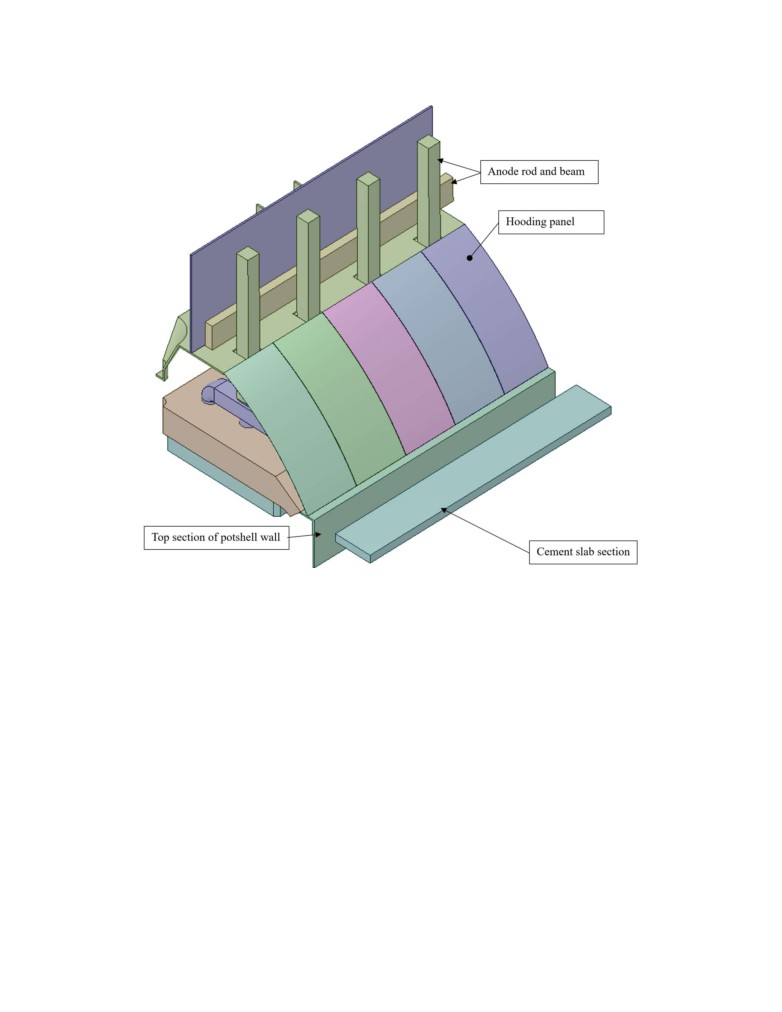
The full AUTODESK CFD model is composed of 4 such anodes and the superstructure above
them. The geometry of the superstructure is also generic and public domain. This time, it is
inspired from a very similar model recently published
[3]. The section of superstructure
contained two quarter sections of feeders and half of an exhaust duct. The model also contains 5
hooding panels, the geometry of those hooding panels was provided by Estampage JPL. It is the
only part of the model that represents a commercially available product (see Figure 5).
In order to predict the HF capture rate, it is important to not only model the gas flow under the
hood but also to model part of the air flow in the potroom and even part of the air flow in the top
section of the basement. For that reason, a section of the cement slab that separates the basement
from the potroom is also part of the model. We can see a representation of that cement slab in
Figure 2 sketch, the worker that is defining the scale is walking on it.
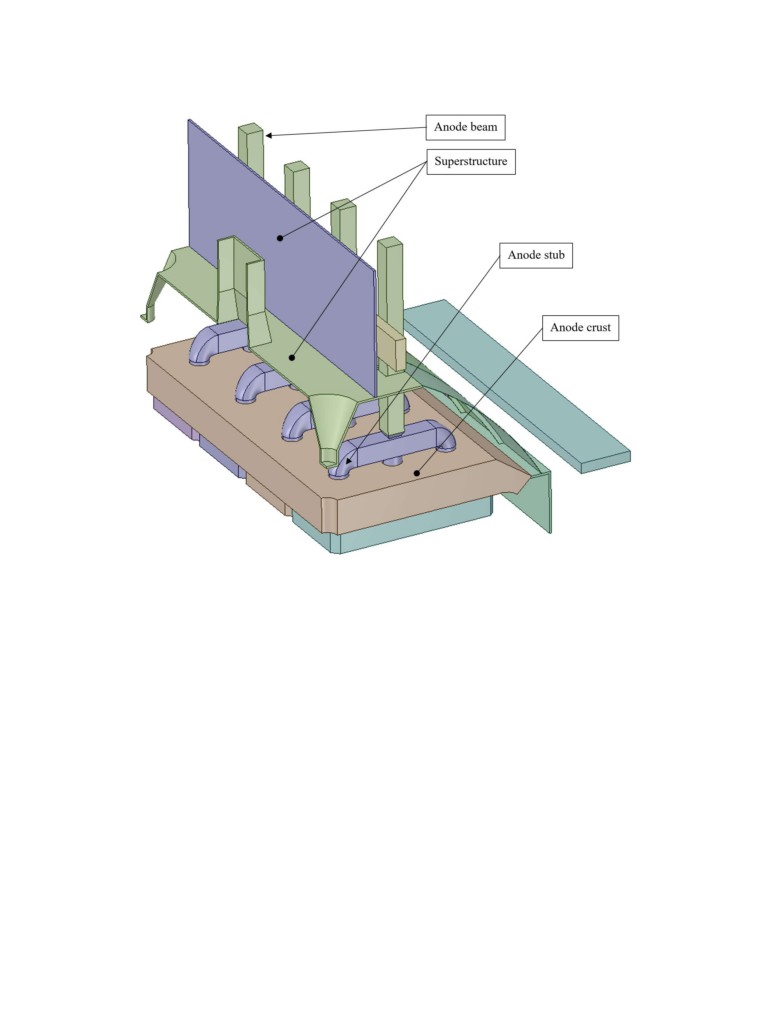
The model solid objects are presented in Figure 4, the stab section is floating on the right side,
in front of the hooding panels and the section of the potshell wall and coverplate is represented
in the model.
3
Figure 4a. Solid objects of the full AUTODESK 3D based model
Finally, a section of the anode beam is also in the model, that section being part of the thermo-
electric submodel. The electric current is equally fed on both ends of that anode beam.
There are two types of solids in the models:1) the thermo-electric solids: the anode beam and
rodsmade of aluminium, the anode studs and yoke made of steel, the anode carbon blocks and
the cast iron connections between the stubs and the anode carbon blocks; 2) the other solids: the
anode crust, the aluminium hooding panels, the steel superstructure and the cement slab that all
are thermal only solids.
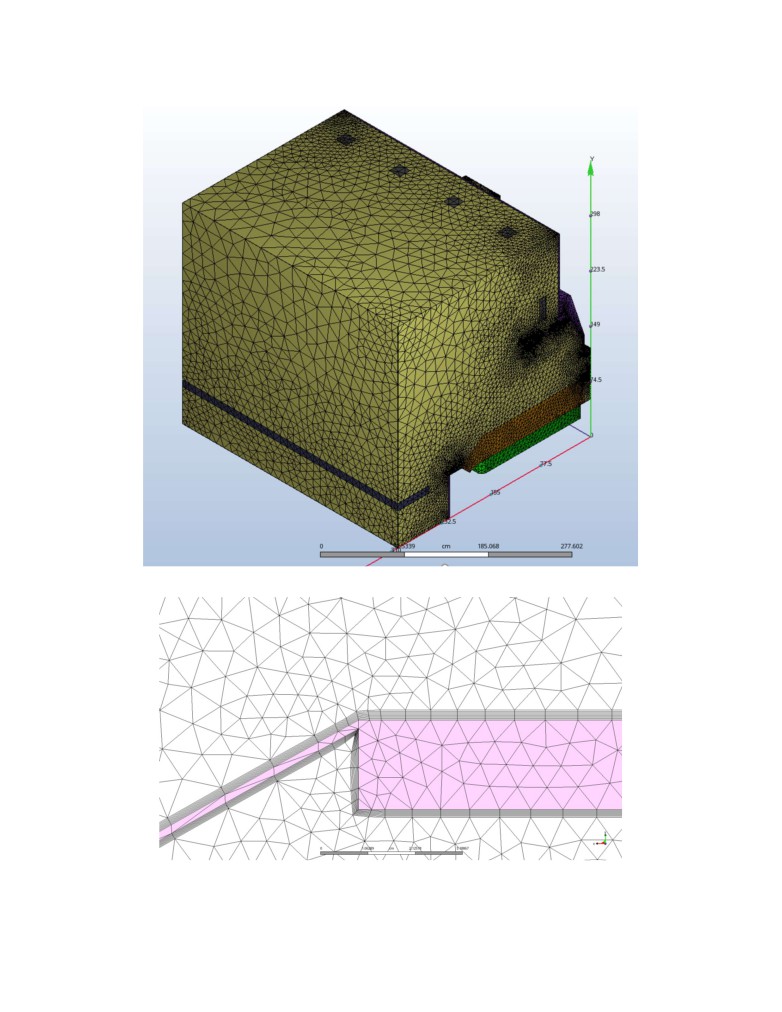
2.2.2. Model Mesh
Fluid elements (in yellow) are added to the model inside the hood, in the top section of the
basement and in the bottom section of the potroom, as seen in Figure 6. The fluid mesh in
contact with solids is first meshed with very thin boundary layer elements that are required to
accurately calculate the heat exchange by convection between those solids and the gas. Figure 7
is presenting an example of that boundary layer mesh. The mesh used in this study is made of
about 7,000,000 fluid elements and about 2,600,000 solid elements.
4
Figure 4b. Solid objects of the full AUTODESK 3D based model
2.2.3. Degree of Freedom Solved in the Model
The model was solved for the temperature in the full domain. In addition to the conduction in
the solid elements and the convection and conduction in the fluid elements, there is a surface to
surface radiation model to calculate the heat exchanged by radiation. This is important both to
well represent the anode top surface heat losses and to well predict the hooding panels
temperature and heat losses to the potroom by convection and radiation.
The voltage is solved in the thermo-electric solid elements. The Joule heating is then added to
the temperature equation. Because of the accurate calculation of the heat transfer by convection
and radiation on the anode top surfaces and the accurate calculation of the ambient temperature
on top of the anode panel, the anode panel heat losses are calculated more accurately than when
using a standard thermo-electrical anode model.
In AUTODESK CFD documentation, it is recommended to solve this mixed convection CFD
flow problem using the low Mach number assumption [4]. For postprocessing purpose only, the
static head removed from the momentum equations is added back. The turbulence is represented
using the k-ω SST turbulence model [4].
5
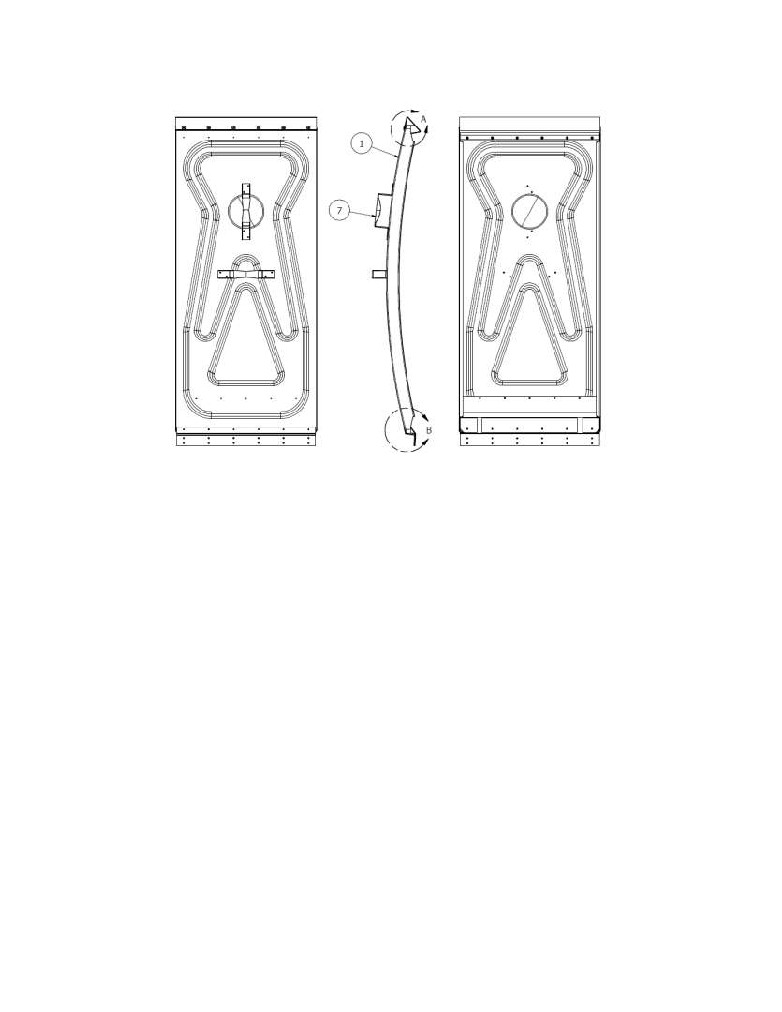
Figure 5. Geometry of the hood panel represented in the model
The gas under the hood is a mix of air, CO2 and HF but it is treated as pure air as far as the gas
properties are concerned. The cell also produces CO that is assumed to burn in CO2 at the crust
surface. The heat of combustion of that CO is added as an extra source term in the fluid
elements in the crust holes at the surface.
The concentration of the HF in the gas is calculated using a passive scalar equation that is
solved in extra. The HF capture efficiency is also calculated at the very end based on the HF
concentration in the exhaust gas and the exhaust gas rate. It could also be independently
calculated based on the HF concentration of the gas escaping from the hood and the escape gas
rate. In the results presented here, no HF escaped in the potroom.
2.2.4. Boundary Conditions in the Model
There are many types of boundary conditions in that model. The first set is for the electrical
voltage equation. The current is assumed to enter equally from both ends of the anode beam.
The total current fed to the model is 4 / 32 * 300 = 37.5 kA. So the anode current density is only
37500 / (160 x 80 x 4) = 0.73 A/cm2 which is the current density reported in [2]. The 0 volt
reference potential is applied on the bottom face of the anodes.
There are heat flux boundary conditions on the solid faces not in contact with the fluids
elements. On each of those solid surfaces a combination of heat transfer coefficient and ambient
temperature is applied, per example 2000 W/m2 °C and the bath temperature for the immerged
part of the anode carbon blocks. The only exception is the forced temperature of the potshell
coverplate (200 °C) and top section of the potshell side wall (300 °C). That section of potshell
side wall in the basement is there only to trigger the natural convection air flow in the basement.
6
Figure 6. Mesh of the full AUTODESK 3D based model
Figure 7. Zoom on the boundary layer mesh on the surface of the solid parts
7
For the CFD equations, the reference 0 pressure is fixed at the top surface of the model in the
potroom. A very small uniform air inflow is imposed in the bottom face of the model in the
basement. The natural convection air flow that developed in the basement is not imposed in any
way so the air flow that enters the potroom from the basement is part of the model solution. The
exhaust gas rate at the end of the exhaust duct is also imposed. In the study presented here, it
was set to 0.3 Nm³/sec which represents 2.4 Nm³/sec for the full 300 kA cell.
Most of the exhaust gas is infiltrated air from the potroom. The remaining is the gas produced
by the cell. Assuming 95% current efficiency, the equations presented in Peter Entner website
[5] have been used to calculate the CO and CO2 cell production. It turned out to be 110.835 kg
CO2/hr and 7.839 kg CO/hr. Once the CO is burned into CO2 this gives 123.15 kg CO2/hr that
corresponds to a gas flow rate of 62.72 Nm3 CO2/hr for the cell or 7.84 Nm3 CO2/hr for the
model equally split into the two quarter feeder crust holes. The burning of the CO is producing
22 kW for the full cell corresponding to 2.75 kW again equally split between the two quarter
feeder crust holes.
For the HF production, assuming an evolution of 26.5 kg F/t Al, the cell is producing 2.535 kg
F/hr or 2.67 kg HF/hr. That HF is not all emitted in its gaseous form but for the present study, it
was assumed that all the HF evolved by the cell is in its gaseous form. This then corresponds to
a production of 3.2 Nm3 HF/hr for the cell.
That 3.2 Nm3 HF/hr is added to the 62.72 Nm3 CO2/hr and converted into air as far as the
properties of the gas produced are concerned. So, the cell is assumed to produce 65.92 Nm3/hr
of gas at the operating temperature corresponding to an “air” inflow of 4.12 Nm3/hr in the
bottom of the two quarter feeder crust holes. That hot air will flow through the crust feeder
holes and will receive the energy from the CO combustion when reaching the surface. In real
cells, that CO combustion produces a visible flame that radiates heat, but that extra radiation is
neglected in the current study as the radiation model available in AUTODESK CFD is only a
solid to solid radiation model.
The concentration of HF is computed in the model using a passive scalar. The only source of
that scalar is the two quarter feeding holes. The concentration of HF in those two inlets is
calculated to be 2.67/ 65.92 = 0.0405 kg HF/Nm3. Assuming 100% HF capture efficiency, based
on the dilution ratio, the average HF concentration in the exhaust gas should be reduced to:
65.93 / (2.4 × 3600) × 0.0405 = 0.000309 kg HF/Nm3
(1)
2.2.5. Model Solution
The model is solved first in steady state mode using the ADV 5 (Modified Petrov-Galerkin)
convergence scheme available in AUTODESK CFD [4]. In the current study, 300 iterations
have been used to converge the steady state conditions. Computing that solution required 18h20
CPU using 6 Intel Xeon E2630 v2 processors operating at 2.6GHz on a computer having 64 GB
of RAM.
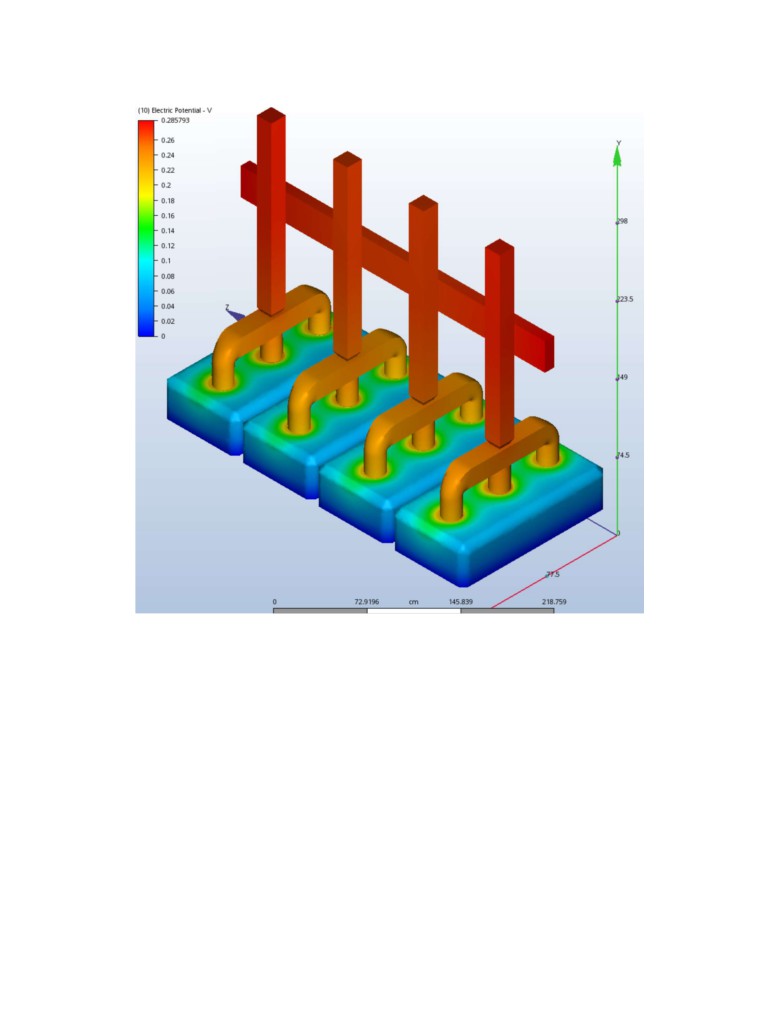
After those 300 iterations, the selected convergence criteria were satisfied. Figure 8 presents the
obtained voltage drop which is again very similar to the one obtained with the ANSYS based
thermo-electric model. Figure 9 presents the obtained anodes temperature showing in particular
the obtained surface temperature for the crust, stubs and yoke. The temperature was obtained
considering the non-linear influence of the temperature of the hooding panels and the gas
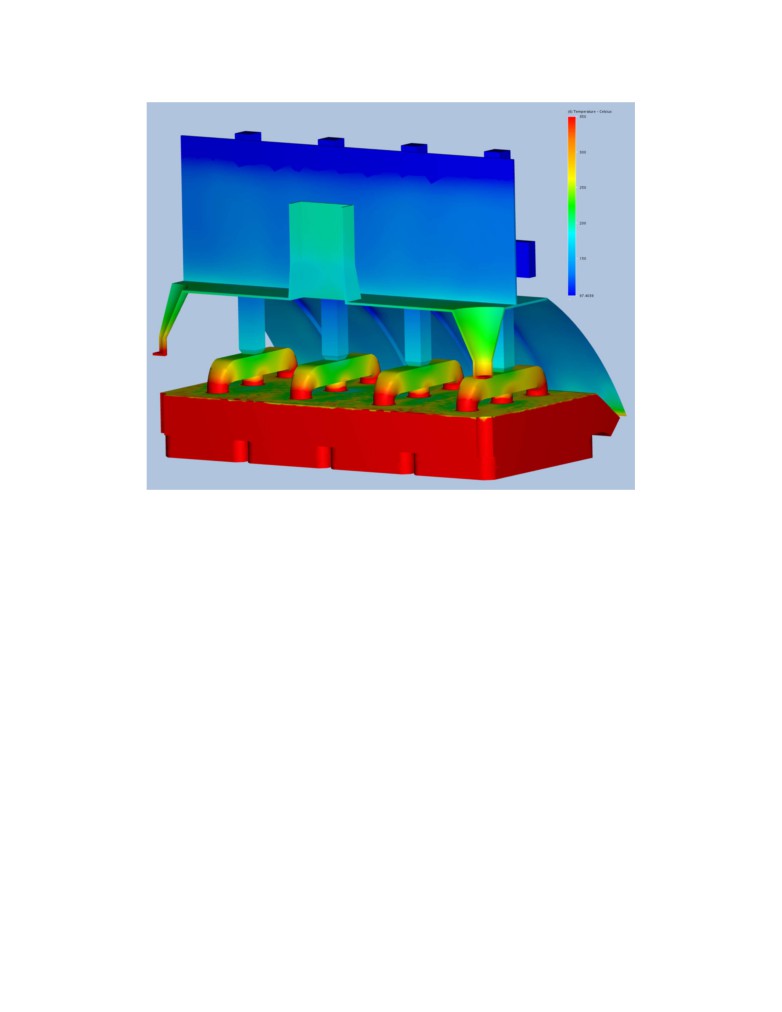
temperature and flow conditions under the hood. Figure 10 presents the predicted temperature of
all the solid objects in the model.
8
Figure 8. Obtained anode voltage drop
The resulting thermo-electric steady-state solution of the anodes and hooding panels is quite
satisfactory. For the CFD solution, we can split it in two regions, the air flow in the potroom and
the gas flow under the hood. Figure 11 is presenting the air flow solution, the potroom “2D”
natural convection flow along the hooding panels and the superstructure is very well
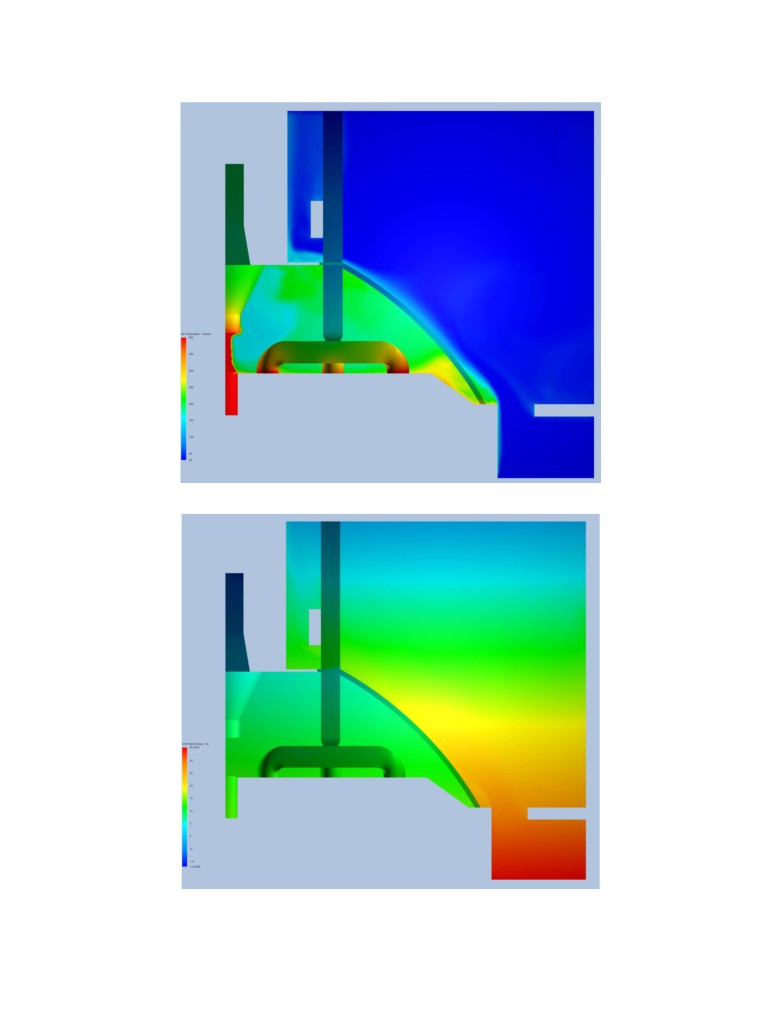
established. Figure 12 is presenting the corresponding air temperature solution also showing the
corresponding “2D” natural convection plume in the potroom and the big temperature difference
between the gas under the hood and the air in the potroom. It is also showing the “flame”
location above the feeder crust hole. Finally, Figure 13 is presenting the corresponding air total
pressure solution, dominated by the hydrostatic pressure variation. The proper solution of the
pressure is important according to Dernedde [6] as it is the difference in the hydrostatic pressure
gradient between the hot gas inside the hood and the colder potroom air that leads to HF leaks in
the top region of the hood if the hoods openings are too big or the hood gas exhaust rate is too
small to generate enough of a global pressure drop under the hood. In that circumstance, the
pressure in the top region inside the hood becomes bigger that the potroom pressure at the same
level and some hot gas with some HF contains is able to escape into the potroom. But this
turned out not to be the case in the present study.
9
Figure 9. Obtained anode panel surface temperature
Despite the fact that no HF was escaping the hood, the calculated HF capture rate was far from
100% in the obtained “steady state” solution as expected. The converged steady state solution is
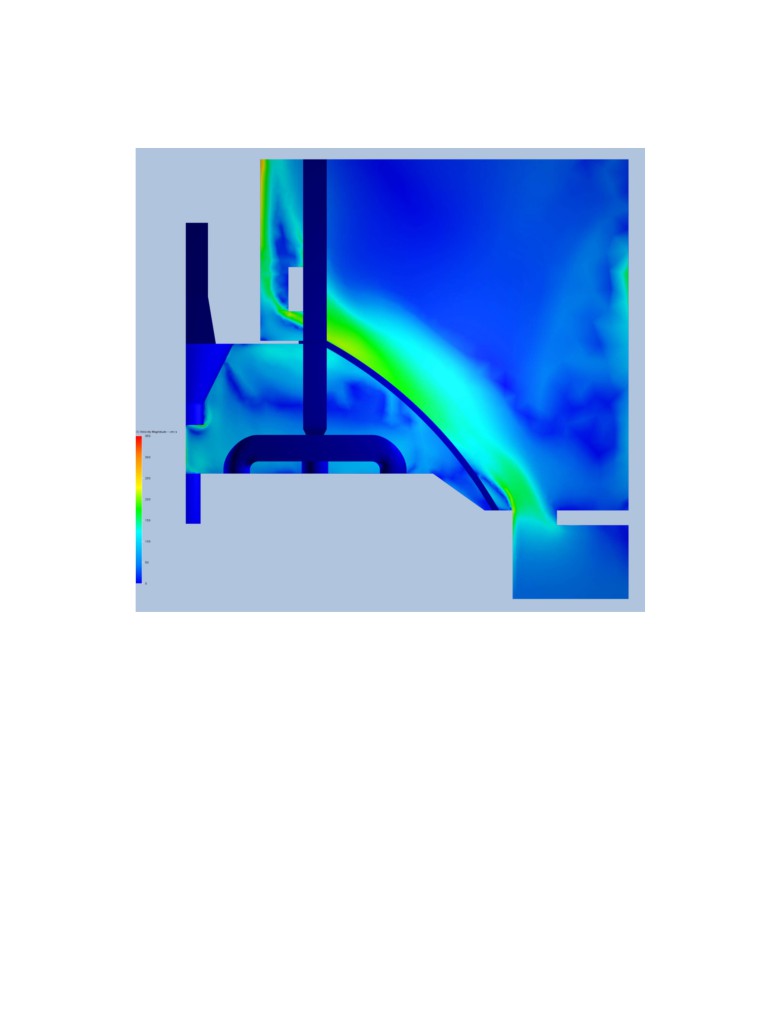
also showing obvious signs of transient behavior despite the usage of a turbulence model. It was
speculated that it is because the natural convection flow is in the transition regime in several
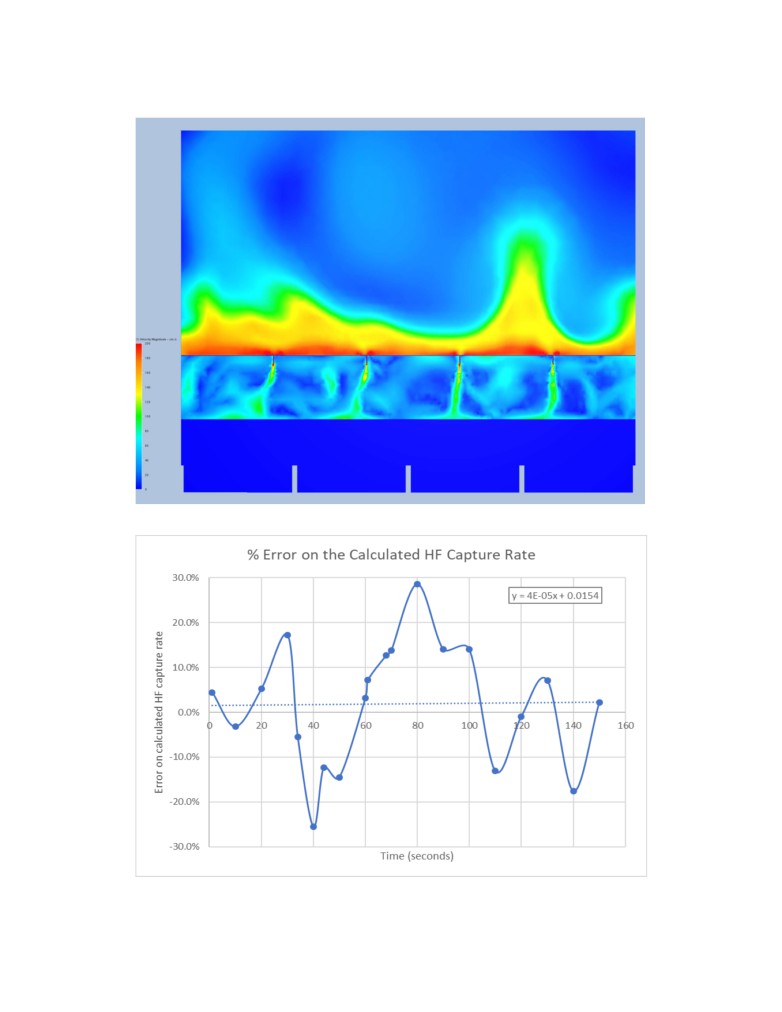
regions of the flow domain. Figure 14 is showing the flow velocity solution in a vertical plane
passing through the hooding panels. It highlights some secondary features of the flow like the
air inlet in the small slots between panels. Those secondary flow features are clearly showing
signs of transient behavior.
For that reason, it was decided to continue computing the flow evolution using the transient
mode starting from that “steady state” initial condition. The flow evolution was computed for a
period of 150 seconds using a 0.1 second time step with 3 equilibrium iterations per time step.
Computing that transient evolution took 103h33 of additional CPU time.
10
Figure 10. Obtained surface temperature of all solids in the model
Figure 15 presents the evolution of the instantaneous HF capture efficiency rate based on the
previously computed expected 0.000309 kg HF/Nm3 concentration assuming 100% capture
based on the dilution rate. The instantaneous values randomly vary plus or minus 30% but the
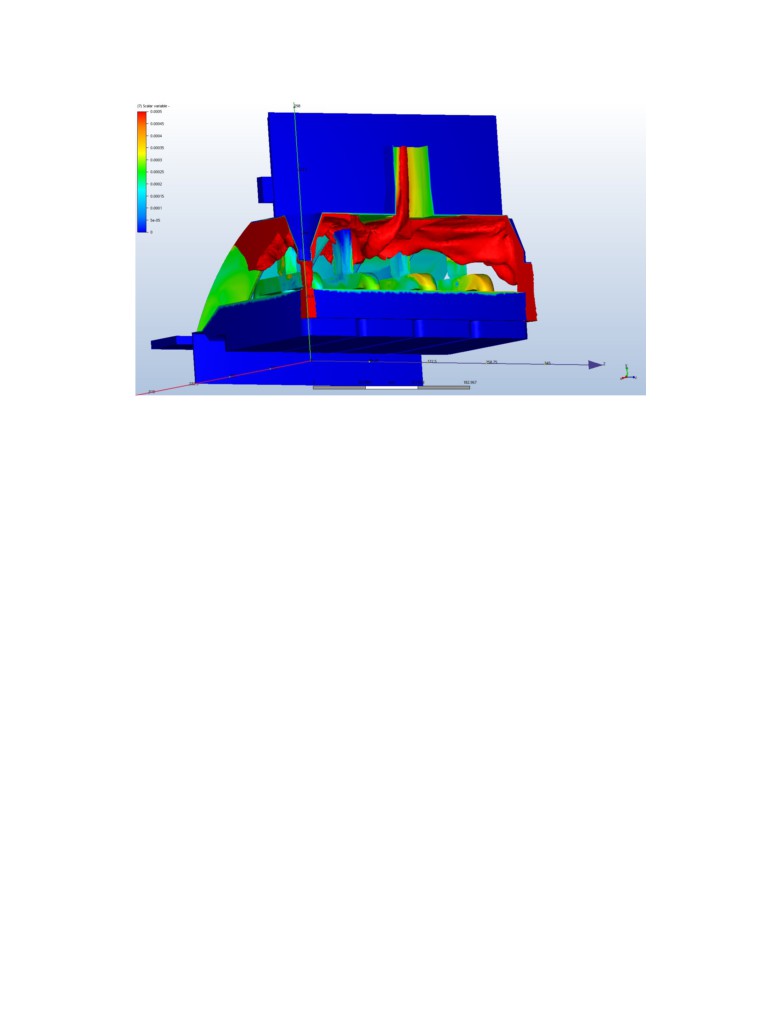
average value is 100 % plus or minus 1% for that full range of 150 seconds. Figure 16 is
showing the instantaneous HF concentration at time 150 seconds of transient evolution showing
clear signs of transient behavior. The selected 0.0005 kg HF/Nm3 isosurface concentration
represents 162% of the HF homogenous dilution concentration, all of the gas in the upper region
of the hood is above that concentration and part of the exhaust gas leaves the hood above that
concentration.
3. Conclusions
The aim of the current work was to demonstrate that it is possible to develop a model that
reproduces well the complex physic occurring under the hood of a reduction cell. This includes
the cell CO2, CO and HF gas production, the CO burning, the radiation heat transfer between
solid surfaces and finally the gas circulation that dictates the convection heat transfer between
the solid surfaces and the gas.
Part of the model solution is the calculation of the hooding panel temperature and heat loss to
the potroom but the more important model prediction is the HF capture rate as function of the
superstructure and hooding panels design and the gas exhaust rate. In the present study, the
capture rate was 100% since no HF was escaping in the potroom. It turned out to be very
difficult and expensive to calculate that HF capture rate efficiency based on the concentration of
HF in the exhaust gas and the dilution rate as this concentration was not uniform in space nor
constant in time.
11
Figure 11. Obtained air flow velocity magnitude
4. Follow-up work
The present work is only the first step toward the development of a tool to design better hooding
panels and better leak limiter around collector bars. This would allow a decrease in the gas
exhaust rate while keeping the HF capture rate very close to 100%.
The next step will be to reproduce the current model Dernedde work [6] which consists of
establishing the minimum gas exhaust rate for a given set of cell operating conditions, hooding
panels and superstructure design. In order to do that, three new cases will need to be simulated
using three reduced gas exhaust rate inferiors to the minimum gas exhaust rate to get some HF
linkage into the potroom. The fit of the obtained HF capture rate as function of the gas exhaust
rate using equation 20 in [6] will directly give a prediction of that minimum gas exhaust rate.
Once the minimum gas exhaust rate is established for the current hooding panels and
superstructure design, a change of design affecting the size of the hood openings could be
introduced in the model and the corresponding revised minimum gas exhaust rate established.
12
Figure 12. Obtained air temperature
Figure 13. Obtained total air pressure
13
Figure 14. Obtained air flow velocity magnitude (vertical plane through panels)
Figure 15. Deviation of the calculated HF capture rate from 100%
14
Figure 16. Isosurface of the HF concentration at 0.0005 kg HF/Nm3
5.
References
1.
Marc Dupuis, Computation of aluminum reduction cell energy balance using ANSYS®
finite element models, TMS Light Metals 1998, 409-417.
2.
Vasili A. Kryukovski, Gennady A. Sirasutdinov, Juergen Klein, and Gerald Peychal-
Heiling, International cooperation and high-performance reduction in Siberia, JOM, Vol
46, No. 2, (1994), 23-25.
3.
Ruijie Zhao, Louis Gosselin, Mario Fafard, Jayson Tessier and Donald P. Ziegler,
Efficiency of pot tightness in reduced pot draft conditions based on multi-length scale
CFD simulations, International Journal of Thermal Sciences, Vol 112,
(2017), 395-
407.
4.
AUTODESK CFD 2017 Help Documentation,
5.
Peter Entner website,
6.
Edgar Dernedde, Gas collection efficiency on prebake reduction cells, American
Industrial Hygiene Association Journal, Vol 51, No. 1, (1990), 44-49.
15