Marc Dupuis |
Marc Dupuis |
Introduction
The Hall-Héroult aluminum electrolysis process is very complex. It involves many different physical and chemical phenomena, which not all are completely understood and are often interacting with each other. Yet, we need to be able to represent those complex phenomena in comprehensive mathematical models to avoid having to design cells by trial and error. And, indeed, this has been done since it is well known that today´s modern smelter technology has been design with the much-appreciated support of these mathematical models1.
In general, we can fit Hall-Héroult mathematical models into three broad categories:
Yet, all those aspects of cell design are linked in different ways:
Unfortunately, at the present time, even taken individually, those models required tremendous computer resources, clearly preventing us from merging all of them into a big «multi-physics» unified model. Yet, model initial development proceeding in that direction has already been made2.
Thermal-electric models
So we will concentrate our attention in this discussion on the thermal-electric aspect of the Hall-Héroult cell modelling and design, keeping in mind that this aspect of the design will influence the other aspects as other aspects of the cell design will influence the cell energy balance.
And unfortunately, even at this level, limited computer resources force us to divide the modelling of the thermal-electric aspect of the process in two categories:
Steady-state models are typically 2D thermal and more often these days 3D thermal-electric finite element models. There is no reason why the three-dimensionality of the cell design (anode studs and collector bar) and the indissociable thermal(electrical coupling should be inadequately reduced into a 2D thermal model. Today, a full 3D thermal-electric finite element half anode model or cathode side slice model only take about ten minutes to solve on a fast personal computer (PC).
On the other hand, if ten minutes is reasonable to solve one steady-state solution, it is much too long to get only one time step in a dynamic model run. That is why, dynamic models are still confined to 0D or 1D geometric representations typical of the second category of thermal-electric models.
3D steady-state thermal-electric models
The goal of 3D steady-state thermal-electric models is to determine as accurately as possible:
My standard approach to achieve the above goal is to develop two independent models:
It has been demonstrated in the past3 that when considering heat transfer by convection, the «enhanced conductivity» of bath and metal are orders of magnitude greater than those of any lining materials. So, it is quite justify and a good modelling practice to consider the bath and metal to be isotherms and to remove them from the model domain.
Having done that, the only coupling between the anode and the cathode parts of the cell is located in the cell´s side channel crust. For practical reasons, I prefer to completely separate the anode part from the cathode part by cutting the crust along an adiabatic line perpendicular to the crust surface.
By having a decoupled half-anode model and cathode side slice model, we can solve them independently. But to do so, we must specify the cell operating temperature and the cell superheat as boundary conditions (i.e. as input to the model). Under such conditions, the models will calculate the global cell heat losses. If the calculated cell losses do not correspond to the separately computed cell internal heat, it means that the cell steady-state conditions do not correspond to the assumed operating cell temperature and cell superheat for that cell design.
This leaves the designer with many options for the next step in the design loop:
The most important thing to remember with this approach is that the user specifies the operating temperature and superheat. The model then calculates the corresponding cell heat losses that may or may not match the cell internal heat generation. In the «classic 2D full cell slice» model approach3, the user specifies the cell internal heat and the liquidus temperature and the model calculates the corresponding steady-state temperature. But, the steady-state temperature may turn out to be unreasonable. This is yet another example of the famous «chicken and egg» issue and should not be a source of concern for a modeler using my approach.
Model validation considerations
I can not stress strong enough that developing a cell model without validating it is a waste of time. Furthermore, using an unvalidated cell model can be very misleading (garbage in garbage out)! So, if you are planning to develop a mathematical model of your cell, be ready to spend the time required to validate it properly.
The best way I know to validate a 3D thermal-electric cell model is to conduct a coordinated «thermal blitz» campaign. Essentially, a «thermal blitz» consists in measuring enough heat fluxes very rapidly around a cell (in stable operating conditions) to be able to integrate them along all the external surfaces in order to obtain an experimental cell heat losses «snap shot» (see Table 1 and 2).
| Heat Flux Measurements for Cell Heat Balance | ||||
| date: 17-Aug-97 | slice no: A2 | |||
| cell: "VAW" 300 | ||||
| Shell Wall | ||||
| Description | Flux | Temp | ||
| Wall above bath level | 2000 | 150 | ||
| Wall bath level | 5500 | 230 | ||
| Wall metal level | 7500 | 250 | ||
| Wall block level above bar | 6000 | 235 | ||
| Left collector bar | 3000 | 190 | ||
| Right collector bar | 3000 | 190 | ||
| Wall collector bar level | 1500 | 90 | ||
| Wall brick level | 1000 | 60 | ||
| Floor near centerline | 500 | 50 | ||
| Floor at quarter point | 500 | 50 | ||
| Floor near corner | 500 | 50 | ||
| Cradle Web | ||||
| Wall above bath level | 1000 | 100 | ||
| Wall bath level | 2165 | 130 | ||
| Wall metal level | 2660 | 140 | ||
| Wall block level above bar | 955 | 125 | ||
| Wall collector bar level | 400 | 60 | ||
| Wall brick level | 155 | 50 | ||
| Floor extension | 0 | 0 | ||
| In the corner | 100 | 35 | ||
| Wall extension wide section | 0 | 0 | ||
| Wall extension narrow section | 0 | 0 | ||
| Floor near centerline | 100 | 35 | ||
| Floor at quarter point | 100 | 35 | ||
| Floor near corner | 100 | 35 | ||
| Cradle Flange | ||||
| Wall above bath level | 500 | 65 | ||
| Wall bath level | 1085 | 80 | ||
| Wall metal level | 1330 | 90 | ||
| Wall block level above bar | 475 | 40 | ||
| Wall collector bar level | 200 | 35 | ||
| Wall brick level | 50 | 30 | ||
| Under the floor | 50 | 30 | ||
Table 1- Thermal blitz input data sheet
| Heat Balance Results | ||||
| date: 17-Aug-97 | Cell: | "VAW" 300 | ||
| Cathode Heat Losses | W / m2 | kW | % | |
| Shell side wall above bath level | 2000 | 11.52 | 1.86 | |
| Shell side wall opposite to bath | 5500 | 31.68 | 5.11 | |
| Shell side wall opposite to metal | 7500 | 43.20 | 6.97 | |
| Shell side wall opposite to block above bar | 6000 | 48.38 | 7.80 | |
| Shell side wall opposite to block between bars | 1500 | 6.48 | 1.05 | |
| Collector bars to air | 3000 | 17.28 | 2.79 | |
| Collector bars to flexible | 60 | 9.68 | ||
| Shell side wall opposite to brick | 1000 | 11.52 | 1.86 | |
| Shell floor close to corner | 500 | 12.54 | 2.02 | |
| Shell floor quarter point region | 500 | 10.44 | 1.68 | |
| Shell floor centerline region | 500 | 8.34 | 1.34 | |
| Cradle above bath level | 889 | 6.08 | 0.98 | |
| Cradle opposite to bath | 1925 | 13.17 | 2.12 | |
| Cradle opposite to metal | 2364 | 16.17 | 2.61 | |
| Cradle opposite to block above bar | 848 | 8.12 | 1.31 | |
| Cradle opposite to block between bars | 356 | 2.43 | 0.39 | |
| Cradle opposite to brick | 132 | 1.80 | 0.29 | |
| Cradle corner | 52 | 1.52 | 0.25 | |
| Cradle below floor close to corner | 100 | 2.76 | 0.44 | |
| Cradle below floor quarter point region | 100 | 2.76 | 0.44 | |
| Cradle below floor centerline region | 100 | 2.76 | 0.44 | |
| Shell end wall opposite to metal | 1500 | 2.61 | 0.42 | |
| Shell end wall opposite to block above bar | 3000 | 7.31 | 1.18 | |
| Shell end wall opposite to block below top of bar | 4000 | 6.96 | 1.12 | |
| Shell end wall opposite to brick | 3000 | 10.44 | 1.68 | |
| Shell coverplate in the ends | 500 | 1.52 | 0.25 | |
| Shell horizontal strip in the ends | 1184 | 18.00 | 2.90 | |
| Shell vertical stiffeners in the ends | 898 | 5.52 | 0.89 | |
| Shell horizontal stiffeners in the ends | 100 | 0.45 | 0.07 | |
| Total for the cathode part | 371.76 | 59.95 | ||
| Anode Heat Losses | ||||
| Crust in side channels | 1700 | 21.48 | 3.46 | |
| Crust above anodes | 1800 | 81.91 | 13.21 | |
| Crust in center channel | 1750 | 3.60 | 0.58 | |
| Studs | 4000 | 27.14 | 4.38 | |
| Yoke | 3640 | 83.87 | 13.53 | |
| Aluminum rod | 822 | 30.31 | 4.89 | |
| Total for the anode part | 248.3 | 40.05 | ||
| Total for the cell | 620.1 | 100.00 | ||
Table no 2: Thermal blitz results table
At the same time, a detail cell voltage measurement is carried out to establish the cell´s internal heat. If the cell was truly in a stable operating condition and the measurements were perfectly carried out (which is not an easy task); the measured cell heat losses should match the cell internal heat within 5%. If this is the case, then the measured heat balance data can be used to validate the cell model.
At the end of the thermal biltz, a series of side ledge profiles should also be measured. By imposing the average measured ledge profile on the validated cathode model, we obtain from the model solution the «experimental» heat transfer coefficients at the fluids/ledge interfaces. Those heat transfer coefficients are then used to predict the ledge profile thickness of the «retrofitted» design.
Obviously, the behavior of the cathode thermal-electric model relies heavily on the lining material properties data defined in it. Having a reliable material properties database is one of the keys of a successful model development. It is especially important not to blindly use data provided by the lining material´s manufacturers since the properties that should be used in the model are not the «new» material properties but the «used» lining material properties after that the lining materials have been affected by sodium diffusion under cell operating conditions. That is why typically, the final model calibration involve adjusting/degrading lining materials properties until the model globally reproduce the measured heat balance within 5%.
On the electric side, the cell models should also match the measured cathode lining drop and the average mid-life anode drop. This usually translates into the adjustment of the models electrical contact resistance between cast iron and carbon.
An extra experimental measurement can be conducted to measure at least one such contact resistance is to setup an instrumented anode. An instrumented anode setup consists of installing thermocouples in and around studs. Those thermocouples normally use to measure temperature only, are use at the same time as voltage probes. With this setup, it is possible to measure the contact resistance both between the steel stud and the cast iron, and between the cast iron and the anode carbon. Obviously, the contact resistance is one of the key parameter in both the anode and cathode models indicating clearly that having a good pressure contact between cast iron and carbon parts is one of the important features of a successful cell thermal/electric design. Yet, it is widely considered as being only a mechanical issue.
Example of 3D model usage: sensitivity analysis
In a recent presentation at the CQRDA symposium4, I presented an example of 3D model application of an imaginary cell retrofit project where I redesigned a 300 kA cell operating at 92.9% current efficiency (CE) and 13.7 kWh/kg into a 265 kA cell operating at 96% CE and 11.9 kWh/kg. Although this was a good demonstration of the power of modelling tools, the fact that I lumped 17 design
changes into one design loop is not an ideal way to demonstrate to what is going on in the model and how the models results should be analysed.
So this time, I will use the same approach used by Bruggeman in his 1990 Light Metal paper3, namely a parametric sensitivity study.
The base case model that I am going to use is in public domain as I created it for demonstration purposes. To create it, I was inspired by the information published by VAW in JOM in February 19945. I basically used all the available information and made «educated guess» to fill the gaps.
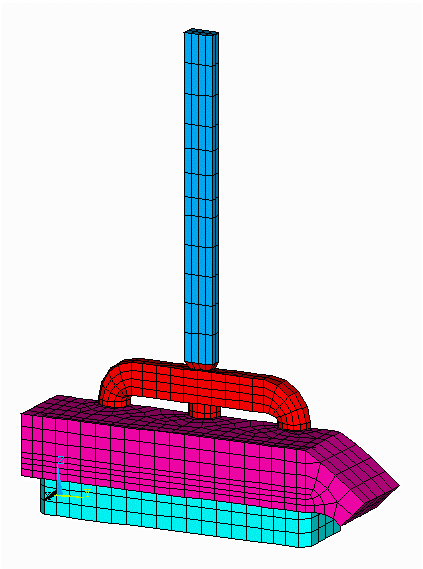
Figure no 1: 3D half anode model mesh
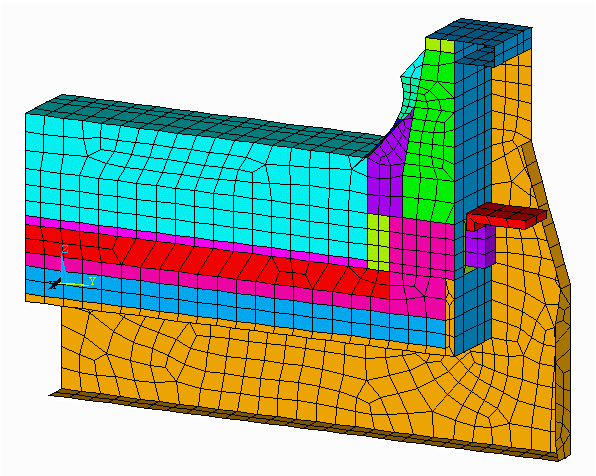
Figure no 2: 3D cathode side slice model mesh
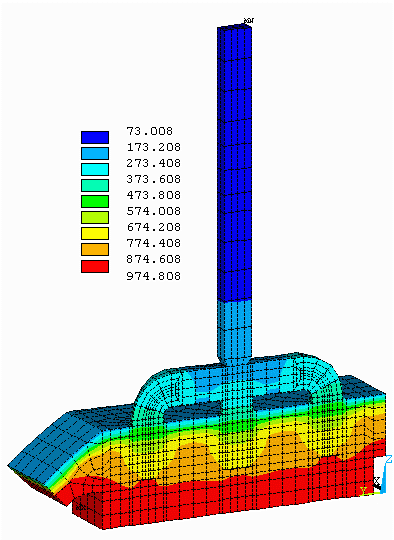
Figure no 3: 3D half anode isotherms
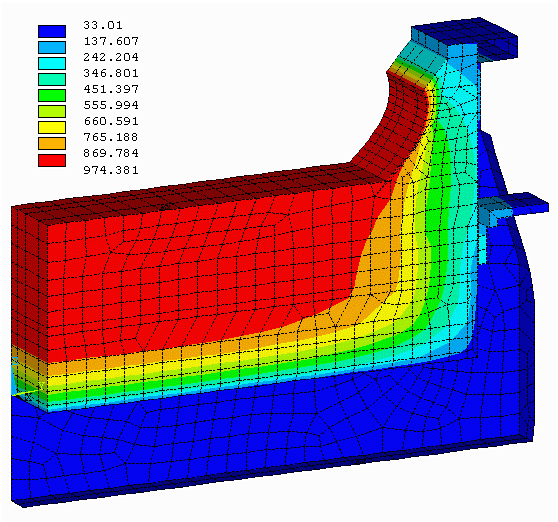
Figure no 4: 3D cathode side slice isotherms
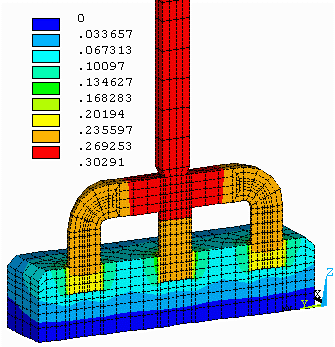
Figure no 5: 3D half anode equipotentials
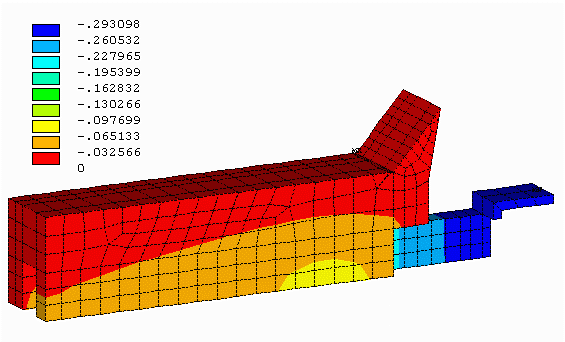
Figure no 6: 3D cathode side slice equipotentials
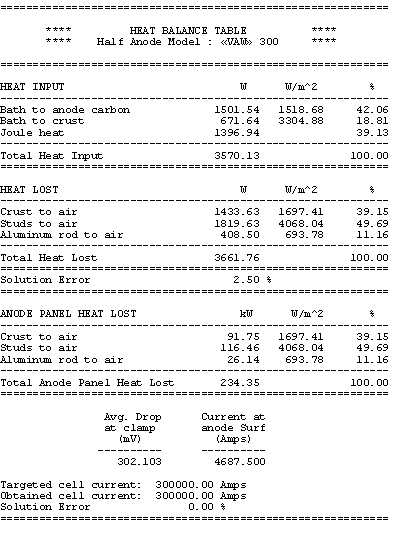
Table no 3: 3D half anode model heat balance table
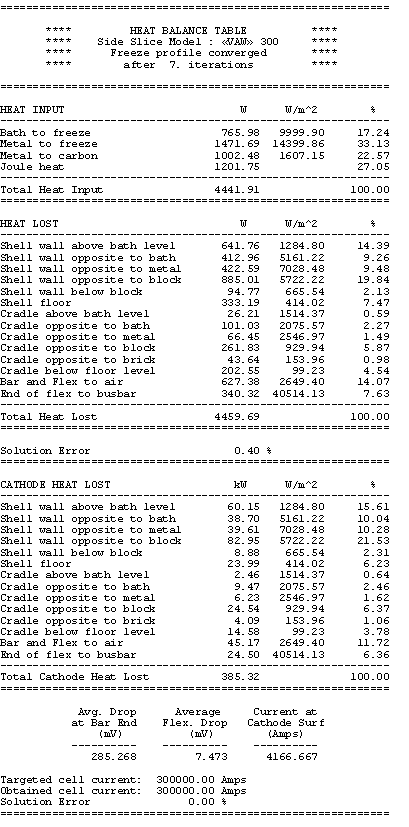
Table no 4: Cathode side slice heat balance table
You can see that the total heat dissipated add-up to 620 kW of which 38% is dissipated by the anode panel and the remaining 62% is dissipated by the cathode shell, cradles and collector bars.
A third table is produced to verify that the total heat dissipated do correspond to the cell internal heat generated. At 5 cm ACD, the cell internal heat turns out to be 622 kW as seen in table 5. Calculation of the cell internal heat is based on public domain equations:
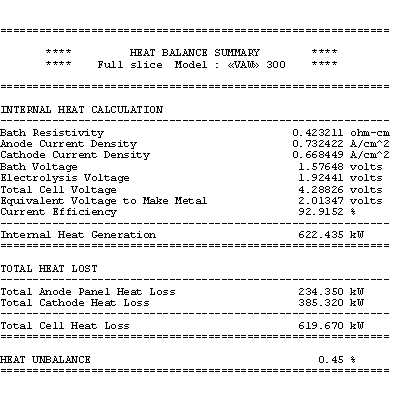
Table no 5: 3D models heat balance summary
As mentioned before, it is up to the user to ensure that the total heat dissipated match the internal heat generation. It is critical that this is achieved before the model results could be considered to correspond to the cell steady-state conditions.
In the sensitivity test case study, the alumina cover is decreased from the 16 cm setup in the base case model to 13 cm. The first step is to rerun the anode model with that change. We can note at this point, that having developed the model by using parameters, it was quite easy to change the base case model into the new configuration. The results of the reduced alumina cover indicate that the anode panel heat losses is increased from 234 kW to 247 kW as shown in Table 6.
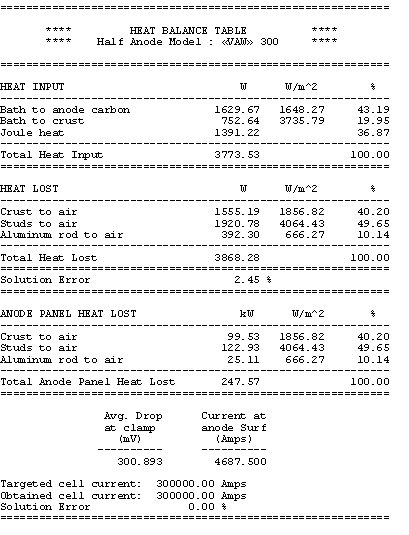
Table no 6: 3D half anode heat balance table with 3 cm less alumina cover
In the second step, the cell operating temperature and the corresponding cell superheat must be decreased to reduce the cathode heat losses of 13 kW in order to maintain the total heat losses equal to the internal heat. It is up to the user to «guess» how much the cell operating temperature should be decreased. Yet, it is straightforward to make a good «educated guess» by assuming that only the heat losses through the ledge will be affected by the change of the operating
temperature and that it will be proportional to the change of the cell superheat. In Table 4 it is shown that at 20°C of cell superheat, the heat going through the ledge in the model is
766 + 1472 = 2238 W
corresponding to 209 kW for the total cathode.
From the above assumption the new cell eutectic superheat should be:
![]()
The cathode model is reran after having decreased the cell operating temperature from 975°C to 973.75°C.
The obtained results are presented in Table 7. The total cathode heat losses are reduced from 385 kW to 374 kW for a new total cell heat loss dissipation of 622 kW, still in thermal equilibrium as shown in Table 8.
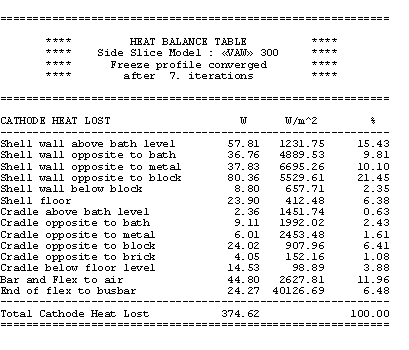
Table no 7: 3D cathode side slice heat balance table at 18.75 °C superheat
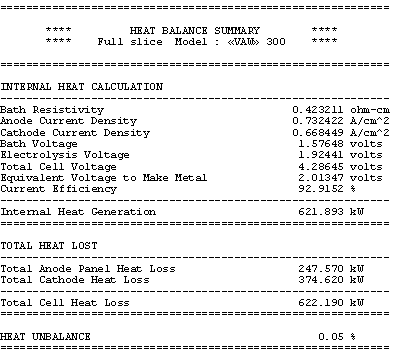
Table no 8: 3D models heat balance summary for the sensitivity case
When we compare the ledge profile of the base case (Figure 7) vs. the ledge profile of the sensitivity test case (Figure 8), the main conclusion we can draw from the analysis is that when we remove 3 cm of alumina cover, the cell reacts by increasing the ledge thickness by an average of 0.74 cm.
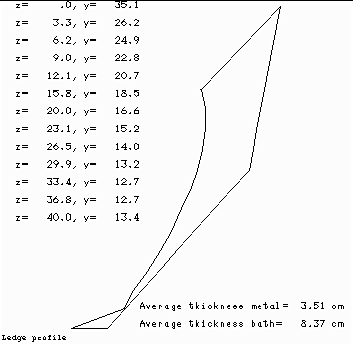
Figure no 7: Ledge profile at 20 ºC of superheat
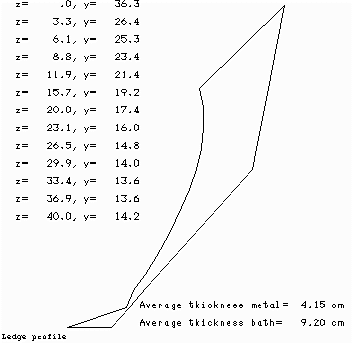
Figure no 8: Ledge profile at 18.75 ºC of superheat
The need for a simple 1D thermal model
Even with a fast PC, the above example of sensitivity study will require about 30 minutes of wall clock time: 10 minutes of central processing unit (CPU) for the anode model, 10 minutes of CPU for the cathode model and 10 minutes for the model changes preparation and model results review.
This is far too long to wait for testing «what if» scenarios like (from the above example):
In the preliminary brainstorming phase of a retrofit project, you don´t want to have to wait 30 minutes each time you want an answer to one of those «what if» questions.
If you want to study the impact of multiple changes in a Monte Carlo analysis, it is obviously out of the question to have to wait 10 minutes per calculation cycle since we will need to conduct thousands of such calculations to make the Monte Carlo analysis.
Additionally, the same is true for the transient analysis. You cannot wait for 10 minutes per time step if you need thousands of time steps to compute the system response for a long enough period of time with a reasonably small time step.
For all those reasons, it is very convenient to develop a simple 1D thermal model of the reduction cell. The simple 1D thermal model that I have developed is based on the following assumptions:
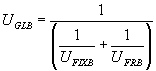
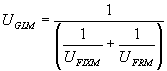
Using the above assumption, it is possible to reduce the 3D finite element thermal model containing thousands of nodes (differential equations) into a system of four 1D equations as follow:
![]()
![]()
![]()
![]()
For the base case model presented above, the following numbers are determined:
| UGLB = 10.53 W/m2°C | UGLM = 15.16 W/m2°C | |
| UBFIX = 29.43 W/m2°C | UFIXM = 21.70 W/m2°C | |
| UFRB = 16.39 W/m2°C | UFRM = 50.26 W/m2ºC | |
| LBF = 8.26 cm | LMF = 3.70 cm |
Obviously, the simple 1D model reproduces very well the 3D base case model results since it was built from it!
Implementation of the simple 1D thermal model into a simple 1D steady-state model
The real test is to compare the behavior of the simplified thermal model against the predictions of the 3D models for the same sensitivity test case presented before.
To do so, the thermal model that predict the global heat dissipation is combined to the set of equations that predict the cell internal heat to come up with a set of equations that predict the thermal unbalance of the cell.
Having done that, it is quite straightforward to apply the Newton-Raphson convergence scheme to find the root (f(x)=0) of the cell thermal unbalance function. That root corresponds to the cell steady-state conditions. What is very convenient is that many parameters appearing in the function can be use as the root search variable9.
Considering that the simple 1D model cannot «exactly» match the 3D models results, the base case 1D model results are presented in Table 9 and 10, using TLIQUID as convergence variable for the Newton-Raphson scheme.
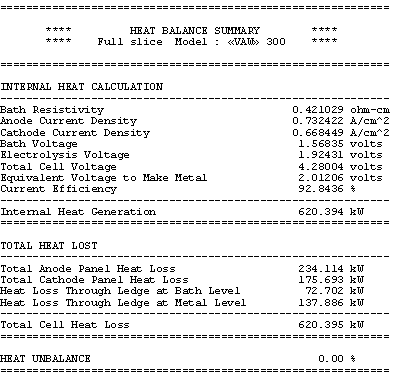
Table no 9: 1D thermal model main results
In the base case, the anode panel heat losses is specified to be 234.35 kW at 975 °C. As a result, the model converges to an operating temperature of 974.05 °°. A the selected bath chemistry, this corresponds to a cell eutectic superheat of 19.47 °C. This gives a global cell dissipation of 620.4 kW. The corresponding ledge thickness is predicted to be 8.61 cm at bath level and 4.04 cm at metal level.
In the sensitivity run, the anode panel heat losses is specified to be 247.57 kW. As a result, the model converges to an operating temperature of 972.89 °C for a decrease in the cell superheat of 1.15 °C to 18.32 °C. The corresponding ledge thickness is predicted to be 9.45 cm at bath level and 4.88 cm at metal level for an average increase of the ledge thickness of 0.84 cm.
With this tool, in a matter of minutes it is possible to obtain answers to the «what if» questions asked previously like «What if I increase the ACD instead of letting the cell cool down?» By changing the convergence variable from TLIQUID to ACD and solving again we get the answer: 5.17 cm ACD will increase the internal heat to the 633.6 kW required to maintained the new cell thermal balance.
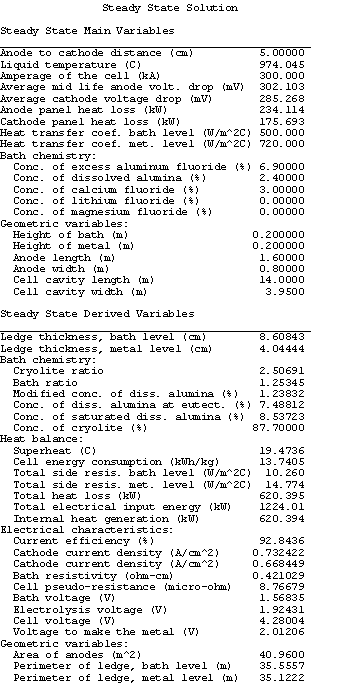
Table no 10: 1D thermal model derived variables
At this point, you may wonder since the 1D model is so fast and flexible, why you should bother to build 3D models? Well, you need to remember that you need the 3D model results to built the 1D model and also that without the 3D models you would not have known that removing 3 cm of alumina cover will increase the anode panel heat dissipation by 13 kW!
Application of the simple 1D steady-state model to carry out Monte Carlo sensitivity study
One of the drawbacks of using only a 3D modelling approach in obtaining the «optimum steady-state design» is that the optimum steady-state solution could very well be on the edge of practical limits. Per example, the ACD can be on the edge of the MHD stability limit or the ledge thickness can be very thin, etc. Yet, you don´t know how sensitive that design will be to process perturbations, which could amplify into serious operation problems.
When designing «on the edge» it is a good engineering practice to allow for a safety margin. One efficient way to estimate the size of the safety margin required is to carry out a Monte Carlo analysis. In one type of Monte Carlo analysis, you may want to assess the risk involved in using mathematical models of a given accuracy to predict a cell behavior in real life. In such a Monte Carlo analysis, you replace the value computed by the 3D models for key results like anode voltage drop, anode panel heat dissipation, etc by a probability function that accounts for the model assumed accuracy.
I personally like to use a Poisson distribution for the probability function of the model predictions because I use the model predictions as the left side limit of the Poisson distribution. This way, my distribution assumes that the model prediction is the best outcome expected with a significant trailing edge for the less favorable outcomes. To follow up with the previous example, I have assigned the distribution presented in Figures 9 to 12 for the anode voltage drop, the cathode voltage drop, the anode panel heat losses and the cathode panel heat losses respectively. In these figures, the smooth lines are the target&45;input distributions and the seesaw lines are the output histograms after 15,000 cycles of random evaluation. All four distributions are based on the same Poisson distribution characterized by a mean of 1, appropriately translated, scaled and if needed mirrored.
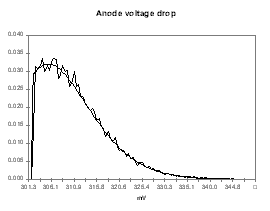
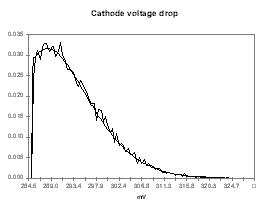
| Figure no 9: Poisson distribution of Vanode | Figure no 10: Poisson distribution of Vcathode |
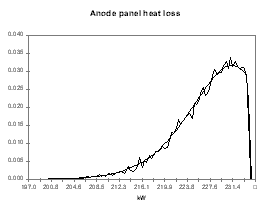
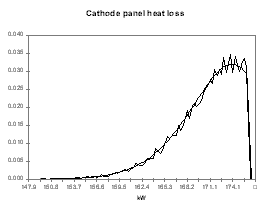
| Figure no 11: Poisson distribution of Qanode | Figure no 12: Poisson distribution of Qcathode |
At every of the 15,000 cycles, the results of the random evaluation of the four input parameters are used to solve the steady-state temperature of the cell with the 1D model. The resulting output distribution is presented in Figure 13. Even with a fast 1D model, it took a few minutes of CPU time to get the results!
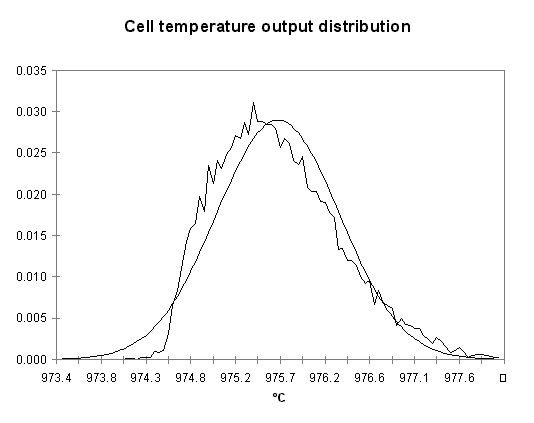
Figure no 13: Temperature output distribution of the Monte Carlo analysis
As shown, the output temperature distribution is neither a Poisson nor a normal distribution although a normal distribution characterized by a mean of 975.67 °C and a standard deviation of 0.645 °C is a fair approximation. We can
obviously compute from the same analysis the distributions of other indirect output variables like the cell internal heat, the cell superheat or the ledge thickness at the bath and metal level (see Figures 14 to 17).
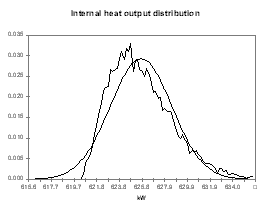
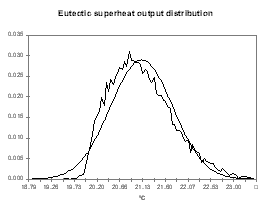
| Figure no 14: Internal heat output distribution | Figure no 15: Cell superheat output distribution |
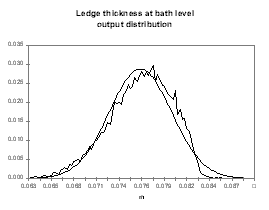
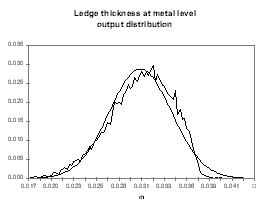
| Figure no 16: Ledge bath output distribution | Figure no 17: Ledge metal output distribution |
The cell design team may not be happy with the idea that the real cell might end up having to dissipate 630 kW instead of the 620 kW predicted by the 3D models. Yet, the only alternative to building up a safety margin of 10 kW in the design is to develop and use more accurate 3D models. At least, with the help of the 1D model and the Monte Carlo analysis, the level of risk associated with using 3D models of a given accuracy can be estimated fairly well.
1D dynamic thermal-electric model
The natural extension of the 1D steady-state model is obviously the 1D dynamic model.
The first extension involves the addition of the following missing elements to the process model:
In addition to the above extensions, the heat balance equation need also the following new key elements:
The second extension involves the addition of a cell control model in charge of alumina additions, anode beam adjustments, metal tapping, anode change, discrete AlF3 additions, etc.
The cell control model can be relatively simple or identical to the control model of a real cell. Yet, here again, the speed of computation dictates what is practical to do, as you don´t necessarily want to have to run the simulation in real time!
The key elements of the control model are:
* Note that the process model describe here cannot predict the cell voltage evolution during an anode effect. Note also that my above-described concept of a 1D cell dynamic model as have been implemented into a commercially available code named ARC/DYNAMIC10.
Example of application: analysis of the alumina feeding cycles effect on the cell thermal behavior
Previously, I raised the issue that it is risky to rely only on 3D steady-state model results to find the «optimum design» without analyzing how that «optimum design» respond to process perturbation. Well now, with the 1D dynamic model, we have just the right tool to analyze that.
To help demonstrate that with modern point breaker feeder (PBF) continuous tracking logic, the notion of steady-state conditions really means a range rather than a point, we are going to simply run the cell dynamic for three weeks through its normal routine. Note that this is even more the case for side break technology as demonstrated in the paper we presented at the TMS in 199611.
We can see in Figures 18 to 21 the evolution of temperature, alumina concentration in the bath, cell pseudo-resistance and ledge thickness at metal level respectively. Although those transient graphs are quite interesting to look at, the histograms of the same data are more revealing in term of «range of normal operation» (see Figures 22 to 25).
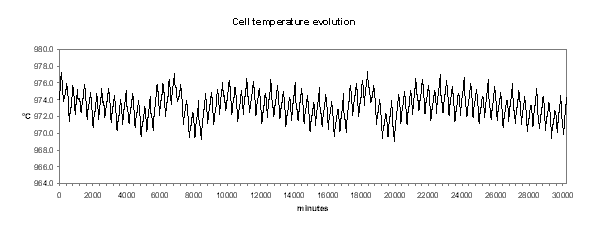
Figure no 18: cell temperature dynamic evolution
In Figure 22, we can see that the histogram of the cell temperature is almost a perfect normal distribution with a mean of 973.3 °C and a standard deviation of 1.21 °C.
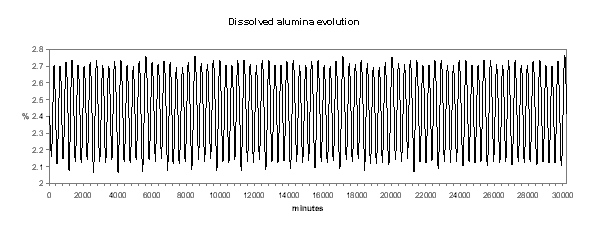
Figure no 19: Dissolved alumina dynamic evolution
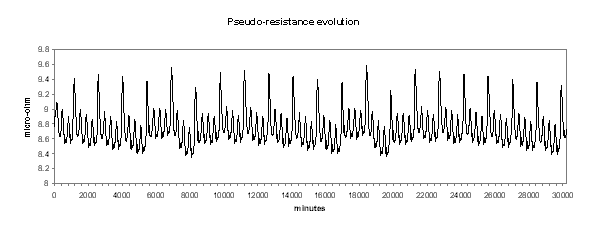
Figure no 20: Cell pseudo-resistance dynamic evolution
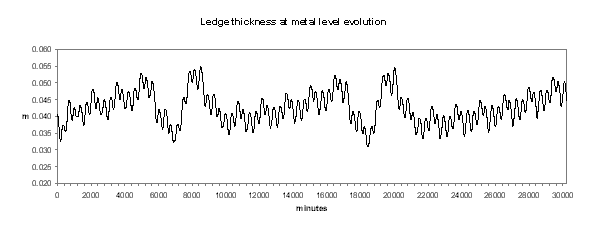
Figure no 21: Ledge thickness at metal level
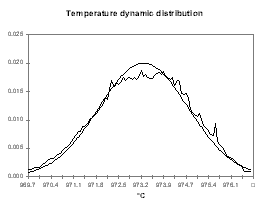
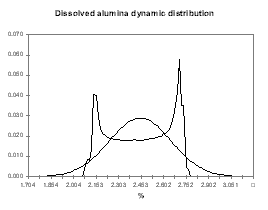
| Figure no 22: Temperature dynamic distribution | Figure no 23: Alumina dynamic distribution |
It is not a surprise to discover in Figure 25 that the ledge thickness at the metal level histogram is the mirror image of the temperature distribution. What is more important for the cell designer is that the mean of the distribution is 4.28 cm and the standard deviation is 0.47 cm.
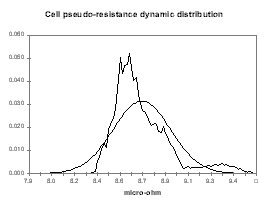
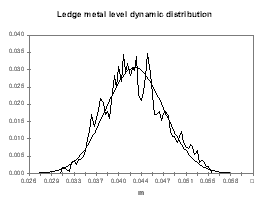
| Figure no 24: Resistance dynamic distribution | Figure no 25: Ledge metal dynamic distribution |
This means that at the equivalent of the «low tide», the ledge thickness is only 3 cm although it was designed to be 4 cm in steady state. We must also remember the fact that when we evaluated the risks involved in designing a cell with models with 5 % accuracy, we estimated that we have a fair chance of getting a cell that will run at an average of 3 cm of ledge at the metal level. We can conclude from the global exercise is that by designing a cell to have 4 cm of ledge in the 3D steady-state model, we have a fair amount of chance to end up with a cell having only 2 cm of ledge left in its normal «low tide» conditions!
Knowing that, it is up to the design team to decide if 4 cm of ledge at the metal level is a safe target for the 3D steady-state model «optimal design solution».
Other applications of the 1D dynamic model
Although I generated my 1D dynamic model concept having the above cell design application in mind, it is also a great tool to help illustrate abstract concepts with hands on test cases during training sessions. We already presented two examples of applications in that area. The first is the illustration of the efficiency of the back electromotrive force (BEMF) to filter the amperage noise in the cell pseudo-resistance dynamic evolution presented at the TMS this year12. The second is a demonstration that the dynamic model using the liquidus superheat definition can very well reproduce the measured cell dynamic evolution, while the dynamic model using the eutectic superheat evolution could not. This second example was presented at the CQRDA symposium this year4.
The last type of application of the 1D dynamic model involves its usage to assist in the development of the cell control logic.
I want to give an example of application of the model in that area that again raises the issue of making sure we have selected the proper model behavior before drawing conclusions based on the model response of what is the best control logic to use.
The exercise is to identify, with the help of the model response, which control logic between the constant nominal feeding or the continuous tracking feeding is the best control logic to use to optimize cell performance.
In what follow, I will try to demonstrate that, for everything else being equal, the answer depends on the selection made in the model of the sign of the effect of the dissolved alumina concentration in the bath on the cell current efficiency. It is an important point since the effect of the concentration of alumina in the bath on the cell current efficiency is still today an unsettled issue because it is so hard to make reliable measurements on industrial cells.
There are two schools of thought today. One school believes that increasing the alumina concentration in the bath increase the cell current efficiency while the other believes that increasing the alumina concentration in the bath decrease the cell current efficiency.
Although breakthrough discoveries are not made by using mathematical models, they are great tools to highlight the implications of using theory A rather than theory B to reproduce a known system behavior.
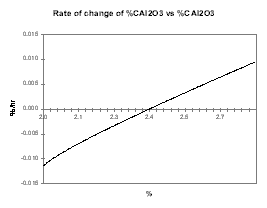
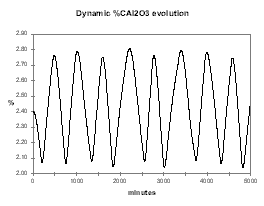
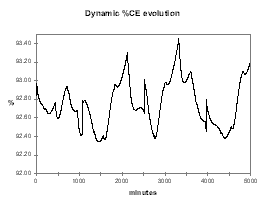
In the present case, we can first assume that increasing alumina concentration will increase the current efficiency and run a sweep of steady-state solutions gradually increasing the alumina concentration. By setting a nominal feeding rate that corresponds to the feeding rate required when the alumina concentration is 2.4 %, Figure 26 presents the rate of change of the alumina concentration when that concentration is off 2.4 %. To help highlight the fact that this corresponds to a stable or auto-regulating system, Figure 27 presents the rate of change of the alumina concentration when that concentration is off 2.4 % multiply by the offset between that alumina concentration and 2.4 %.
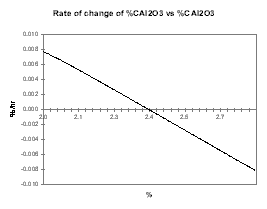
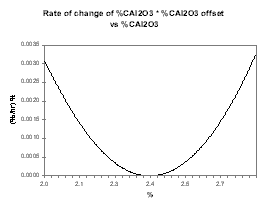
| Figure no 26: Rate of change of alumina | Figure no 27: Rate of change of alumina * offset |
Then we assume that increasing the alumina concentration decreases the current efficiency, run the same sweep of steady-state solutions and produce the same two curves presented in Figures 28 and 29. This time, Figure 29 highlights the fact that the system is intrinsically unstable since it will always drift away from its steady-state condition.
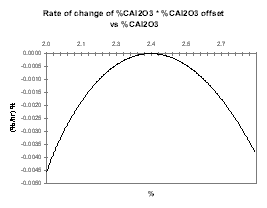
| Figure no 28: Rate of change of Alumina | Figure no 29: Rate of change of Alumina * offset |
The fact that the cell is able or not to auto-regulate its concentration of dissolved alumina and should be operated at high or low alumina concentration in order to
maximize the current efficiency has obviously a profound impact on the selection of the appropriate control logic strategy.
If the slope of the CE vs. %Al2O3 is positive, we can take advantage of the cell auto-regulation features and operate constantly at the nominal feeding rate, knowing that if we are feeding it a bit off the nominal rate, the cell will auto-compensate for it.
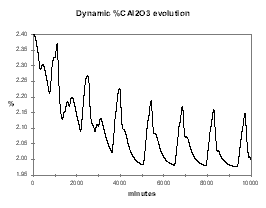
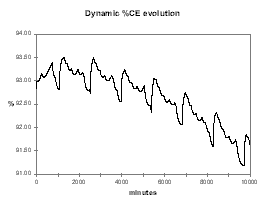
As example, Figure 30 shows the dynamic evolution of %Al2O3 when we are feeding the cell 0.5 kg/hr less than its nominal 180 kg/hr feeding rate at 2.4 % alumina concentration. As we can see, within a week, the cell reaches a new equilibrium at a bit more than 2.0 % alumina concentration and a corresponding lower current efficiency (see Figure 31).
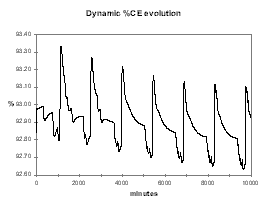
| Figure no 30: Dynamic alumina evolution | Figure no 31: Dynamic %CE evolution |
In reverse, Figure 32 shows the dynamic evolution of %Al2O3 when we are feeding the cell 0.5 kg/hr more than its nominal rate. Again, within a week, the cell reaches a new equilibrium, this time at around 2.6 % alumina concentration and a corresponding higher current efficiency (see Figure 33).
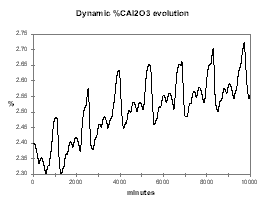
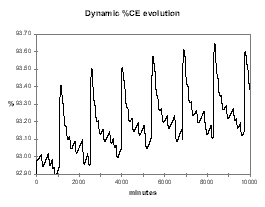
| Figure no 32: Dynamic alumina evolution | Figure no 33: Dynamic %CE evolution |
From that type of behavior, one can see that it would be advantageous to operate constantly the cell at a nominal rate that corresponds to an alumina concentration of around 3.5 %. That would maximize both the current efficiency and the power efficiency knowing that the cell will self-compensate small fluctuations in the targeted feeding rate.
On the other hand, if the slope of the CE vs. %Al2O3 is negative, there is no steady-state feeding rate, as the cell will always drift either toward AE or massive slugging conditions. This is demonstrated first in Figure 34, starting with the same conditions as in the previous case (2.4 % alumina concentration with 0.5 kg/hr extra feeding), in a week the alumina concentration reaches 3.8 % continuing toward massive slugging conditions and very bad current efficiency (see Figure 35).
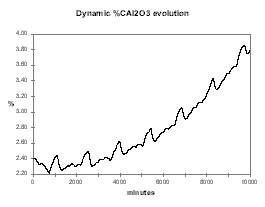
| Figure no 34: Dynamic alumina evolution | Figure no 35: Dynamic %CE evolution |
Even more interesting to help demonstrate that the concept of a stable nominal feeding rate does not exist if the slope of the CE vs. %Al2O3 is negative, is the dynamic evolution of the alumina concentration starting at 2.4 % with 0.5 kg/hr less feeding. As we can see in Figure 36, the cell first accelerates fast toward an AE but is going out of that AE at a higher alumina concentration than the initial 2.4 %. At that higher alumina concentration, the same feeding rate that was before an under-feeding rate, is now an over-feeding rate that will eventually lead to a massive slugging condition in another week of operation or so.
It should not be a surprise because if the CE vs. %Al2O3 is negative, maintaining a stable alumina concentration in the cell is like walking on a tight rope. It requires a constant balance adjustment and that is exactly what the continuous tracking feeding logic does.
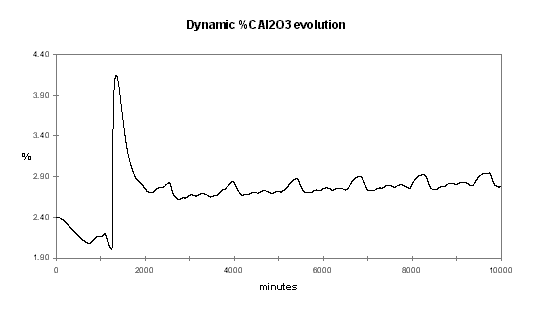
Figure no 36: Alumina dynamic evolution with negative %CE/%Al2O3 slope
The continuous tracking feeding logic is perfectly adapted to the case where the slope of the CE vs. Al2O3 is negative because:
Figure 37 illustrates the efficiency of the continuous tracking control logic to keep the alumina feeding under control at the lowest concentration possible in order to maximize the cell current efficiency and avoid AE (see figure 38).
| Figure no 37: Dynamic alumina evolution | Figure no 38: Dynamic %CE evolution |
In conclusion, although these simulations did not offer indisputable evidences, I am sure that an experimented process engineer will rapidly be able to decide which of the two modeled cell behaviors correspond to his/her experience of the real process behavior. This indicates in an indirect manner what theory is more successfully matching the known behavior of the cell, and should stimulate researchers to try to discover why this is the case and settle this issue once and for all.
Conclusions
In general conclusion, I hope I was able to convince you of the value of using process simulation models to assist you in your work, since I strongly believe that they offer tremendous opportunities to improve the productivity of all of the smelters in operation today.
References