PERFORMING FAST TREND ANALYSIS ON CELL KEY DESIGN PARAMETERS

Marc Dupuis* and Warren Haupin**
*GéniSim Inc
3111 Alger St.
Jonquière, Québec, Canada G7S 2M9
**2820 Seventh Street Road
Lower Burrell, PA 15068 USA

Abstract

Four fast algebraic models that respectively calculate the anode panel heat loss, the cathode bottom heat loss, the anode voltage drop and the cathode voltage drop have been developed and incorporated into the Dyna/Marc 1.7 lump parameters+ cell simulator. The results from Dyna/Marc 1.7 are compared with results from more complex ANSYS® based 3D thermo-electric finite element models.

With the addition of these four algebraic models to the lump parameters+ cell simulator, it is now possible to perform fast trend analysis of key design parameters like the anode stud diameter, the stud hole depth, the collector bar size or the type or grade of cathode block.

In order to illustrate the increased power of the lump parameters+ cell simulator as a brainstorming session "what if" tool, the previously published retrofit study of a 300 kA cell into a 350 kA cell was repeated, this time using only the lump parameters+ cell simulator as modeling tool.

Introduction

It is important to well understand the physics of the heat dissipation inside the lining of an aluminum reduction cell to be able to represent it properly in a mathematical model.

The key feature to be represented accurately is the 2 zones heat loss mechanism [1,2]. In one zone, the driving force is the global thermal gradient between the cell operating temperature and the cell ambient temperature. In the other zone, the driving force is the cell superheat!

3D finite element based thermo-electric models that are converging the ledge profile as part of the solution [3] reproduce very well that dual zones heat loss mechanism as well as the complex geometry of the cell. Unfortunately, they are too time-consuming to be used efficiently in a brainstorming session at the beginning of a cell retrofit project. They cannot provide fast answers to "what if" questions raised during these meetings.

2D+ finite element based [3,4] or 2D finite difference based [5] models converging the ledge profile also represent well the dual zones of heat loss and, at the same time, represent fairly well the cell's complex geometry. These days, computers are fast enough for these models to provide an answer to brainstorming "what if" questions in a matter of minutes. This would be fast enough to answer a few questions but having to wait often for the answers of multiple questions will definitely break the rhythm of the meeting!

The last option would be to use a lump parameter+ model [4,6]. This is the simplest possible model that still represents the two zones heat dissipation of the cell. This model is so simple, that you can get answers to "what if" questions in a fraction of second. Nevertheless, as demonstrated in [7,8], the accuracy of the lump parameters+ model predictions are surprisingly accurate considering its simplicity.

Unfortunately, up to now, the lump parameters+ model was so simple that it could not assess the impact of changes of such basic design parameters as the anode stud diameter or the cross section of the collector bar on the cell heat balance. This meant that its utility as a stand-alone modeling tool in a brainstorming session was limited.

For that reason, the original lump parameters+ model has been expanded by adding to it four new algebraic sub-models that respectively calculate the anode panel heat loss, the cathode bottom heat loss, the anode voltage drop and the cathode voltage drop. Those new algebraic sub-models are based mainly on correlations developed in the late 1950's [5] when using complex mathematical models to design a cell was clearly not an option!

Anode panel heat loss sub-model

All four new algebraic sub-models are based on semi-empirical correlations. The initial work done in the 1950's was based on correlations with measurements while the recent development is rather based on correlations with 3D ANSYS® model results.


The total anode panel heat loss is assumed to be the sum of three independent parallel paths: one goes from the bath to the surface of the anode cover through the anode carbon, one goes directly through the crust in the different channels and one goes from the bath to the surface of the studs, yokes and rods exposed to the air through the anode carbon and the metallic components of the anode.

The thermal resistance of the path going through the anode carbon and the cover material above it is computed using a standard heat transfer equation. The same technique is used for the thermal resistance of the path going through the crust in the channels. The change of the crust/cover material thermal conductivity between its loose and dense state is taken into account as a thermal conductivity step change at a given temperature.

The evaluation of the heat loss through the studs, yokes and rods is based on an empirical relationship mostly dependent on the stud diameter and the height of the cover material around it. But, it is affected also by the amount of Joule heat produced in the cast iron/carbon contact resistance (see [9] for the detailed equation of this and the other three sub-models).

It is relatively straightforward to calibrate the new algebraic anode panel heat loss sub-model in order for it to reproduce the 3D ANSYS® model results for the base case configuration. This is done by adjusting such parameters as the crust thermal conductivity transition temperature or the loose crust thermal conductivity.

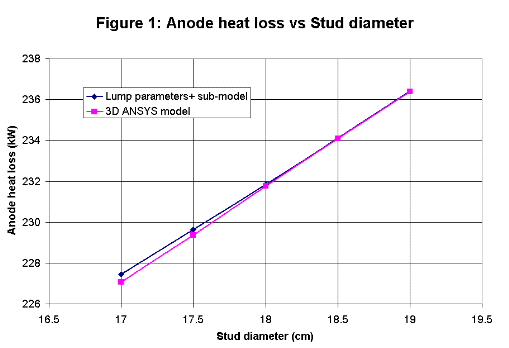
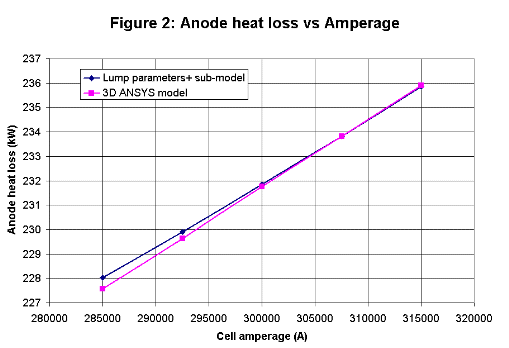
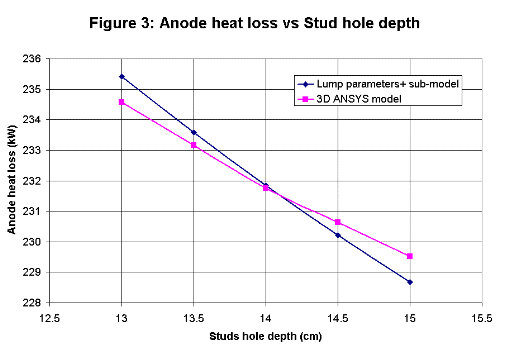
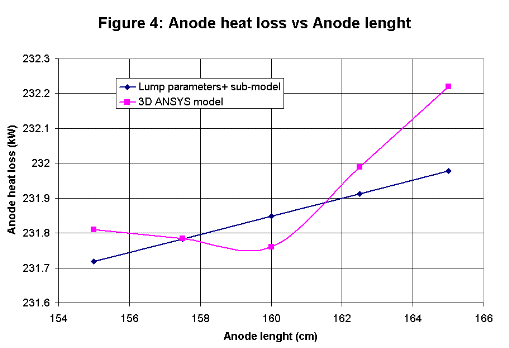
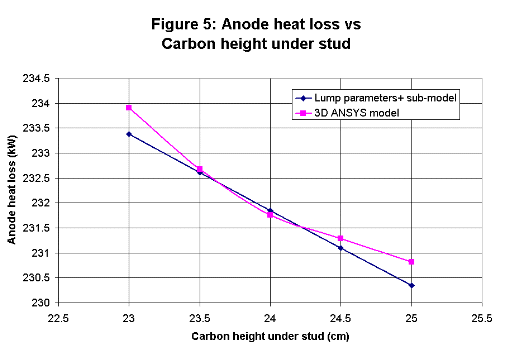
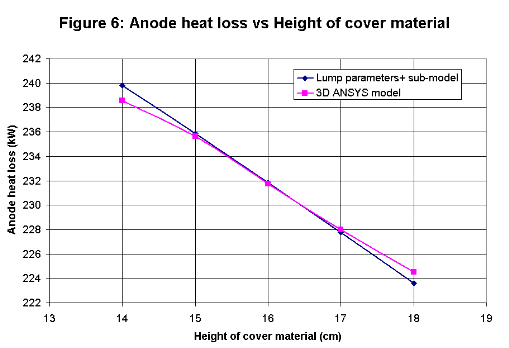
After calibration, the accuracy of the new algebraic sub-model was tested by comparing its trend analysis of such key design parameters as the stud diameter or the thickness of cover material with those produced by the 3D ANSYS® model studies (see Figures 1 to 6).


Considering the relative crudeness of the new algebraic sub-model, the accuracy of its trend analysis predictions when compared with those obtained through much more time and effort with the 3D ANSYS® model is quite remarkable!

Cathode bottom heat loss sub-model

Similarly to the anode panel heat loss, the cathode bottom heat loss is assumed to be the sum of three independent parallel paths: from the metal to the shell floor through the cathode blocks and the cell bottom lining, from the metal to the shell lower walls section through the cathode blocks and the cell side lining (pier) and finally from the metal to the collector bars through the blocks and the bars themselves.

The thermal resistance of the path going from the metal pad to the shell floor is computed using a standard heat transfer equation. The calcium silicate layer, if it is present, is assumed to have two different thermal conductivities (initial and degraded) with a step transition occurring at a prescribed temperature. All the other layers (cathode block, bedding material, firebrick, semi-insulating brick and insulating brick) are considered having a uniform and invariable thermal conductivity.

As it was done for the anode studs, the collector bars heat loss is calculated using an empirical relationship, this time, function of the bar cross section and the current density.

Algebraic calculation of thermal resistances through the lower section of the cell walls is complex and requires some use of judgment regarding heat flow paths. Therefore, these thermal resistances are not computed by Dyna/Marc 1.7. They are rather taken as invariable user inputs to the model. These inputs are obtained from an ANSYS® based calculation of the cathode.

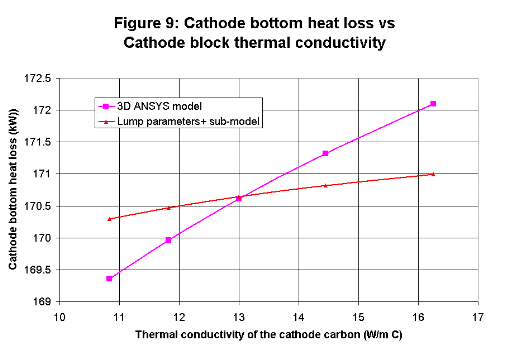
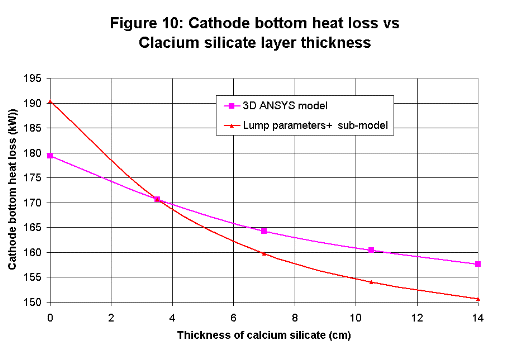
For this reason, the new sub-model cannot be used to investigate changes in the pier region. Nevertheless, it is now possible to analyze the impact on the cathode bottom heat loss of many important design parameters like the size of the collector bar cross section, the thickness of the calcium silicate insulating layer or the type or grade of cathode block.

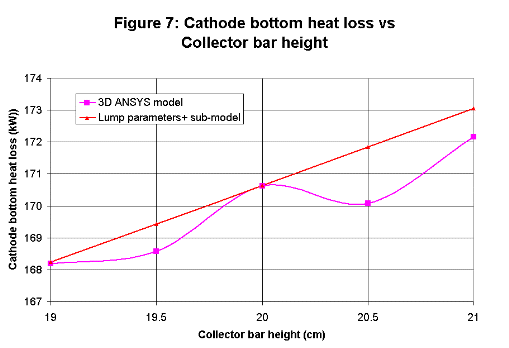
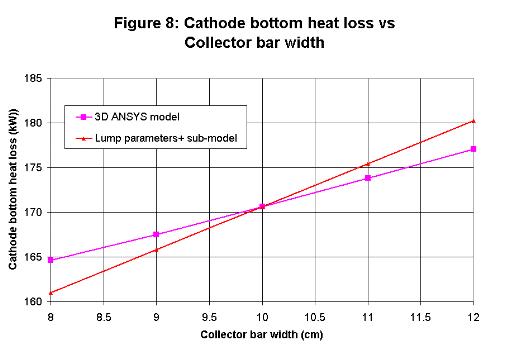
The results of trend analysis performed with the new sub-model and the comparison with those obtained using the 3D ANSYS® model are presented in Figures 7 to 10.


Anode voltage drop sub-model

Changes to key cell lining design parameters like the stud diameter or the collector bar cross section not only affect the cell global thermal resistance, they also affect the global cell electrical resistance, which in turn affects the cell internal heat and cell thermal balance.

Modeling the anode requires a new algebraic anode drop sub-model in parallel with the new algebraic anode panel heat loss in order to also take into account the electrical impact of key design parameter changes on the cell's thermal behavior in the lump parameters+ cell simulator.

The global anode electrical resistance is evaluated as the sum of four resistances in series: the resistance of the carbon under the stud(s) where the current is assumed to travel vertically at a uniform current density, the resistance of the carbon around the stud(s) where the current is assumed to travel radially in an horizontal plane, the carbon/cast iron contact resistance and the resistance of the metallic part of the anode up to the anode beam (without specifying the yoke or the rod geometry).

The evaluation of the carbon/cast iron contact resistance voltage drop is based on an empirical equation. Considering the drastic simplification of the current paths over which the other three electrical resistances are evaluated, it is fair to say that these components of the anode voltage drop are evaluated using semi-empirical equations.

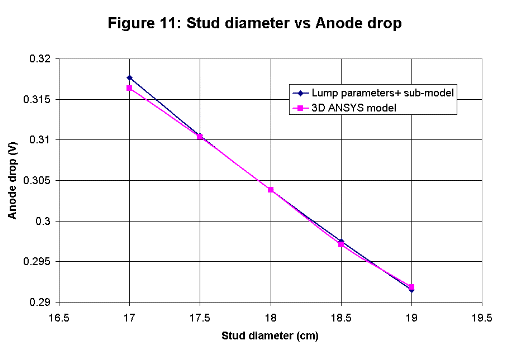
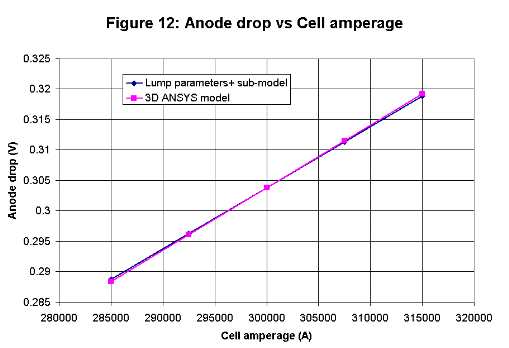
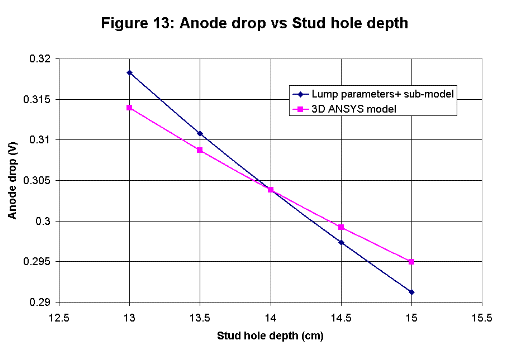
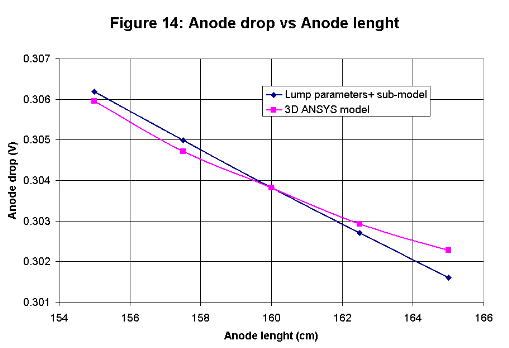
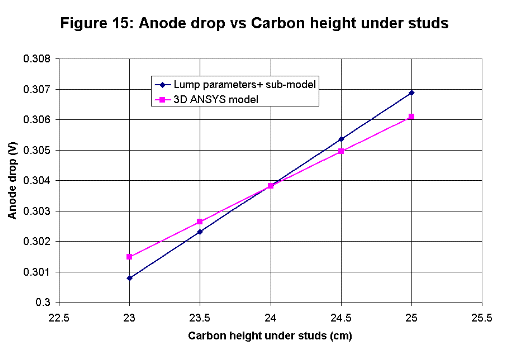
Despite the empirical nature of the formulation, the trend analyses of the new algebraic anode drop sub-model compare extremely well with those obtained using the 3D ANSYS® model (see Figures 11 to 15).


Cathode voltage drop sub-model

It is obviously also necessary to add a new algebraic cathode voltage drop sub-model in tandem with the new algebraic cathode panel heat loss sub-model.

The global cathode electrical resistance is evaluated as the sum of three resistances in series: the resistance of the cathode blocks above the collector bar where the current is assumed to travel vertically at a uniform current density, the carbon/cast iron contact resistance and the resistance of the collector bars from the end of the cast iron connection up to the flexible.

Again in this case, the evaluation of the carbon/cast iron contact resistance voltage drop is based on an empirical equation. The voltage drop evaluation in the carbon blocks above the bars can be considered to be semi-empirical due to the drastic simplification of the current path. Even for the collector bars, the physics was simplified by assuming that the steel has a uniform and high temperature giving a uniform electrical resistivity inside the shell and a uniform and low temperature giving a uniform lower electrical resistivity outside the shell.

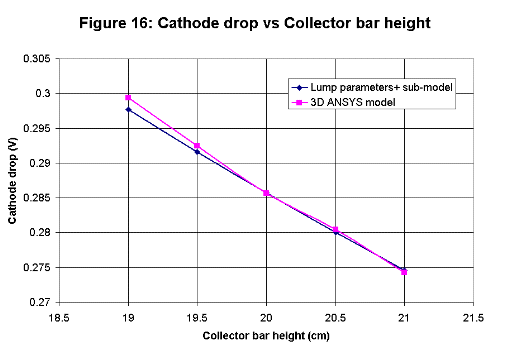
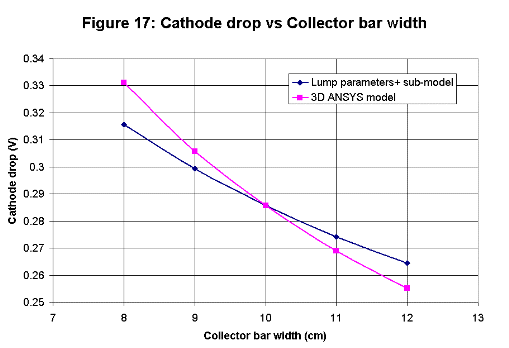
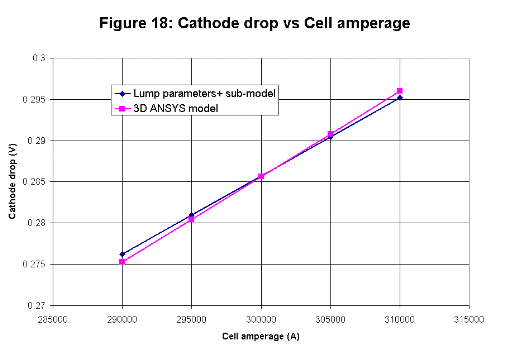
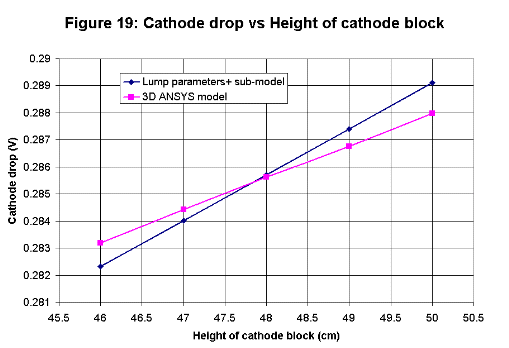
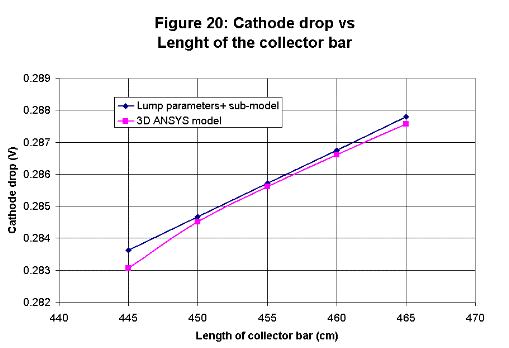
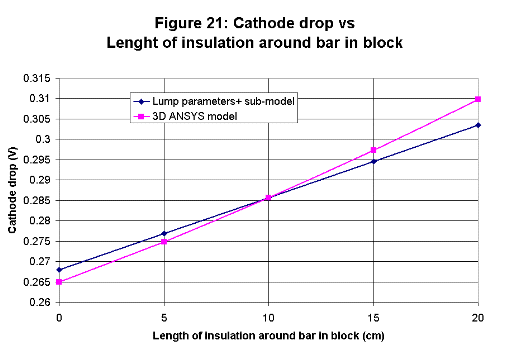
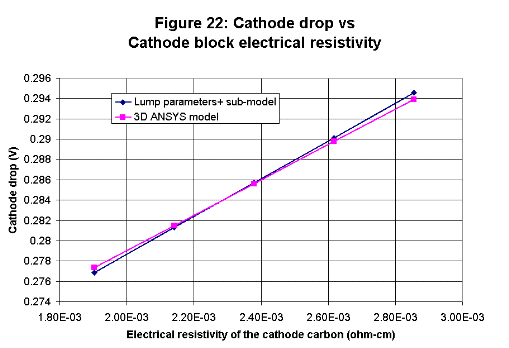
Again, the trend analysis obtained using the new algebraic sub-model agreed very well with results obtained using the 3D ANSYS® model (see Figures 16 to 22). This seems to indicate this it is somewhat easier to simplify the electrical behavior of the cell than its thermal behavior.

With the addition of this fourth new algebraic sub-model in the lump parameters+ cell simulator, we are now ready to test its usefulness in the context of using it as the only tool to answer "what if" questions in a brainstorming session at the beginning of a cell retrofit project.


Retrofit of a 300 kA cell into a 350 kA cell

In reference [7], a step-by-step retrofit study of a 300 kA cell into a 350 kA cell is presented. A total of 9 changes were required to be able to push the amperage up to 350 kA. Those are:

1) Decreasing the ACD from 5 to 4 cm
2) Increasing the anode length from 1.6 to 1.7 m
3) Increasing the excess AlF3 from 10.9 to 13.5 %
4) Substituting the cathode block grade from HC3 to HC10
5) Increasing the cathode length from 3.47 to 3.67 m
6) Substituting the side block material from HC3 carbon to silicon carbide
7) Decreasing the side block thickness from 15 to 10 cm
8) Decreasing the anode cover thickness from 16 to 10 cm
9) Increasing the stud diameter from 18 to 19 cm

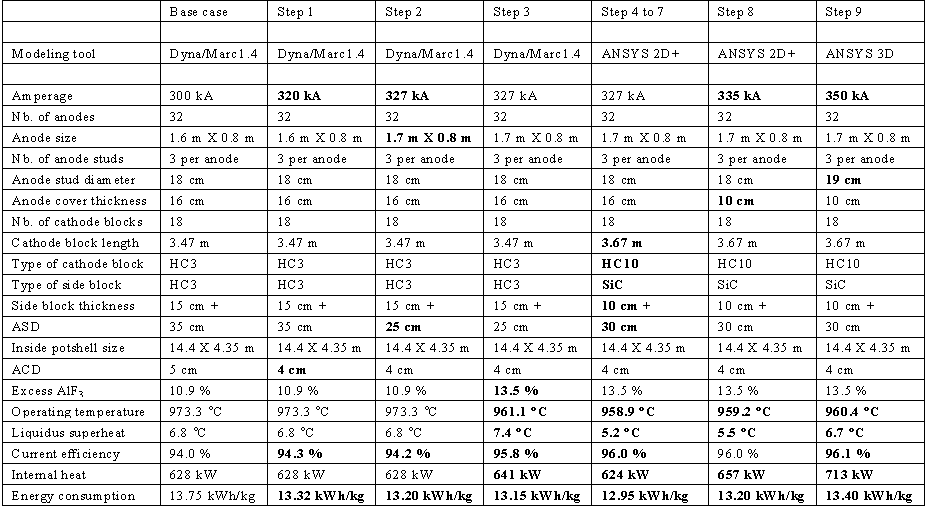
Out of those 9 changes, only the first 3 could be analyzed using the lump parameter model. The remaining 6 changes were analyzed using either the 2D+ or the 3D ANSYS® based full cell slice models. The summary of the results that were obtained is presented in Table I.

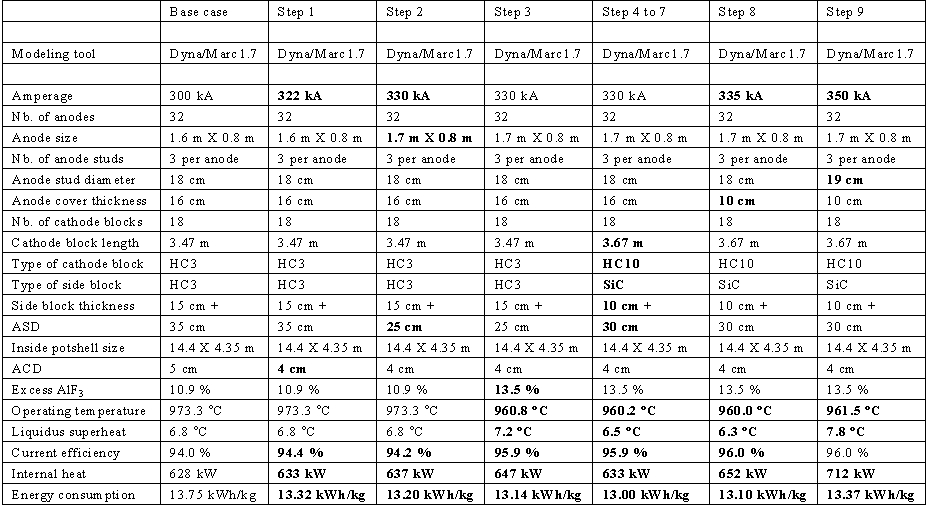
The exact same 9 changes of that retrofit study have then been analyzed using the upgraded version 1.7 of the Dyna/Marc cell simulator. Table II presented the summary of the new results obtained. They are quite similar to those presented in Table I. The main difference is in the time required to get them: computing the results of Table II required at most a few seconds of computing while around 40 minutes of computing were required to obtain results presented in Table I.

It is quite easy to imagine that it is possible to produce the results presented in Table II and many extra similar ones (what about the impact of increasing the bar size, etc.) during a brainstorming session.

Waiting 5 minutes for the results of a 2D+ model not considering the time required to change the model setup between runs is certainly at the limit of what could be considered manageable. Waiting 30 minutes for the results of a 3D model on the other hand is clearly out of the question.

There is no doubt that the results obtained with a 2D+ model and even more with a 3D model are more reliable than those obtained with an ultra simplified and in great part semi-empirical lump parameter+ model. Yet, at the brainstorming phase of a new cell retrofit project, speed of analysis is far more important than absolute accuracy. No one's idea should be rejected without first analyzing its merits and the best ideas are rarely the first ones that comes to mind!


Table I : Results from the original retrofit study

Table II : Results from the reproduced retrofit study


Extension to a Greenfield design at 400 kA

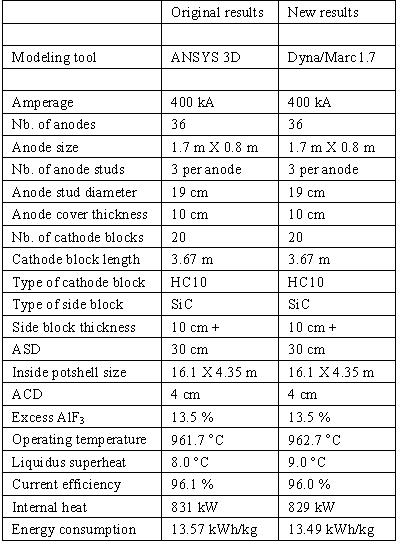
In reference [7], the retrofitted 350 kA cell design is then extended into a 400 kA cell by increasing the cell length by 1.7 m, going from 14.4 to 16.1 m. To carry on that study, four modeling steps were required:

1) Recalibration of the lump parameter model using the results of the ® 3D model at 350 kA
2) Analysis of the impact of adding 4 new anodes using the lump parameter model
3) Analysis of the impact of that cell extension using the ANSYS 2D+ model
4) Analysis of the impact of that cell extension using the ANSYS 3D model

With the new version of the cell simulator, there are no needs to recalibrate or double-check the results using more complex models. Similar results can now be obtained very quickly in a single modeling step. The originally obtained results are compared with the new results in Table III.


Table III : Results of the Greenfield study


Conclusions

It was demonstrated that fairly simple semi-empirical algebraic equations can be used to calculate the anode panel heat loss, the cathode bottom heat loss, the anode voltage drop and the cathode voltage drop with a quite acceptable level of accuracy. This was demonstrated by comparing the trend analysis results generated by the algebraic equations with those generated by much more complex 3D ANSYS® based models for key design parameters like the anode stud diameter or the collector bar cross section.

It was also demonstrated that with the additions of the four new algebraic sub-models, the lump parameter+ model, also called Dyna/Marc 1.7 cell simulator, can be used as a stand-alone modeling tool to carry out a complete retrofit study without significant loss of accuracy in predicting operational results.

In summary, the improved lump parameters+ model is:

. Able to analyze the impact of changing key design parameters
. Compute results extremely rapidly
. Generate reliable results

This makes it an ideal tool to analyze "what if" scenarios raised during a brainstorming session at the beginning of a new retrofit project.

References

  1. F.J. Stevens McFadden, "Energy Balance and Cell Dynamics: Considerations for Cell Design, Operations and Process Control", Proc. 6th Aust. Al. Smelting Workshop, (1998), 289-320.

  2. J.N. Bruggeman, "Pot Heat Balance Measurements - An Overview", Proc. 7th Aust. Al. Smelting Workshop, (2001), on CD.

  3. M. Dupuis, "Computation of Aluminum reduction Cell Energy Balance Using ANSYS® Finite Element Models", Light Metals, (1998), 409-417.

  4. M. Dupuis and R. Lacroix, "Development of a 2D+ Dynamic Model of an Aluminum Reduction Cell", Proceeding of the 38th Conference on Light Metal, CIM, (1999), 41-55.

  5. J.N. Bruggeman, "A Pot Heat Balance Modeling Tool for Potroom Engineers", Proc. 5th Aust. Al. Smelting Workshop, (1995), 192-213.

  6. M. Dupuis, "Process Simulation", TMS Course on Industrial Aluminum Electrolysis, (1997).

  7. M. Dupuis, "Thermo-Electric Design of a 400 kA Cell using Mathematical Models: A Tutorial", Light Metals, (2000), 297-302.

  8. M. Dupuis, "Modeling Power Modulation", TMS Light Metals, (2002), 489-493.

  9. M. Dupuis and H. Côté, DYNA/MARC version 1.7 User's Guide, (2002).